| Home | E-Submission | Sitemap | Contact Us |  
top_img
Environ Anal Health Toxicol > Volume 37:2022 > Article
Omokpariola: Influence on storage condition and time on properties of carbonated beverages from utilization of polyethylene terephthalate (PET) bottles: chemometric and health risk assessment

Abstract

The effect of storage condition (room temperature and sunlight exposure) of eight carbonated beverages sold in Nigeria were assessed over a period of 15 weeks of storage time. Properties such as antimony (Sb) leaching, pH, acidity, specific gravity (S.G.) and total soluble solid content (TSSC) were analyzed using appropriate instrument and methodology at three weeks interval respectively. The concentration of Sb determined ranged from 0.001–0.011 mg/L and 0.001–0.0015 mg/L for room temperature and sunlight exposure. pH was between 2.82–4.81 and 2.82–4.82. TSSC were 0–14 O brix and 0–14.96 O brix. Acidity were 0.025–0.19 and 0.025–0.34. Specific gravity was 0.9921–1.052 and 0.9921–1.0577. The result shows that pH decreased with time as Sb, TSSC, acidity and S.G. increased with time thereby influencing significance (p<0.05). Difference in Sb amounts shows that sunlight exposure had more impacts compared to room temperature as storage time increased. TSSC values increased steadily leading to hydrolysis of sugar and other chemical ingredients, thus affecting the specific gravity. Acidity impacted by increased reactivity from carbon dioxide present, which reduces pH of the drink. Chemometric assessment such as contamination factor and pollution load index indicate low concentration and no pollution associated. Factor analysis conducted showed that all parameters and storage time were positively interrelated except for pH due to side reaction. Cumulative variance showed high variance (>50). Health risk assessment conducted for adults and children showed that Tolerable Dose Index and Hazard Index were below one, thus indicates no adverse health impact as the values were relatively higher in children compared to adults. Prolong consumption of carbonated drinks stored longer than expected can cause fatigue and headaches on a short-term basis, and weight loss and diabetes on a long run especially in children. Regular parental monitoring is advised to mitigate health impact for children.

Introduction

Carbonated beverages are sold in cheap plastics, glass or cans [1]. These packaging materials are made of different component that has the potential to cause climatic actions over a period leading to contamination [2]. Plastics bottles are made from polyethylene terephthalate (PET) using antimony trioxide (Sb2O3) catalyst due to its thermal, mechanical and inert properties [3,4]. PET materials are used for domestic and industrial purposes such as packaging food and beverage including the reuse of spent bottles for herbal beverage in Nigerian markets [1], which has less shelf life causing tremendous environmental menace [5,6]. Bloomberg media states in 2019 that Nigeria consumes over 150 metric tons of beverage-based PET materials [7].
Dissolved antimony metal has been discovered in plastic bottle water and food packs around the world from different quality assessment [3,815], which is because of antimony (Sb) leaching from PET based materials. Cheng et al. [16] stated that recycled bottles contain approximately 300 mg/kg of antimony [16]. Belzile et al. [17] reported 24 mg/kg in food. A number of factors are associated with Sb leaching potential such as storage condition, increased temperature, pH change, PET color matrices and aging, ultraviolet and visible radiation and microbial action [1820]. With the aforementioned factors, antimony will leach into food and drinks causing health issues from different exposure pathway (oral and inhalation) [2].
In Nigeria, carbonated beverages are consumed daily by all adults and children across social status owing to the fact that it is cheap with distinctive taste and thirst satiating abilities [1,21]. These drinks are stored in unethical manners by wholesalers, middlemen and retailers that are exposed to extreme sunlight and or may have expired before selling it to the populace by retailer, which is of public health concern [22]. Several government-based agencies in Nigeria regulates food and drinks including packaged materials and drinks including packaged materials such as National Environmental Standards and Regulation Enforcement Agency (NESREA), Standard Organization of Nigeria (SON) and National Agency for Food and Drug Administration and Control (NAFDAC) with an aim to mitigate health and ethical issues, enforce good manufacturing practice and ensure clean environment [23,24]. This has not been possible due to bureaucratic issues over the years, which forms the basis of this research to investigate the impact of various factor, storage time and condition on properties of popular sold carbonated beverages in Nigeria. The aim and objectives of the study to assess the influence of storage condition and time on physiochemical properties of polyethylene terephthalate (PET) bottles in addition to chemometrics and health risk assessment. The significance is to assist regulators and manufacturers with proper information on storage effect that are usually attributed to wholesalers, middlemen or retailers influence from products handling in addition to health implication from consumption exposure to the Nigerian masses.

Materials and Methods

Sample collection

An on-the-spot survey was conducted on popular PET bottled beverage brands sold and consumed in Nigeria markets. Eight different brands were purchased in August 2020 from Eke-Awka main market of Anambra State, Nigeria. The carbonated beverage were altogether ninety-six samples as brand name, batch number, manufacturing and expiry date was collected and presented in Table 1.

Sample preparation

Two samples (16 bottles in total) were collected from different brands to analyze and use as control. Forty bottles, that is five bottles per brand was kept at room temperature (cool and in a dark room), where different tests were carried out such as: antimony leaching test, pH change, total soluble solid content (TSSC) test, specific gravity, acidity after exposure time (3,6,9,12 and 15 weeks respectively). The remaining forty bottles was exposed to sunlight equally in an open space, same parameter test and exposure time as previous assessment at room temperature.

Qualitative determination

Antimony leaching test

100 mL of carbonated beverage was sampled into a beaker and boiled using a hot plate until volume reduced to 30 mL. 10 mL of perchloric acid and nitric acid was added to solution, which was boiled at 95 °C for 10 mins after which 20 mL of hydrogen peroxide was added to it. The solution was further boiled until it became colorless and was allowed to cool. 5 mL of boric acid solution was added, thereafter allowed to cool and filtered using No.12 Whatmann filter paper. The filtrate was transferred in a volumetric flask and made up to meniscus level with deionized water and labelled according. The sample were sent for spectrometric analysis using atomic absorption spectrophotometer [25].

pH

30 mL of carbonated sample were measured into a beaker, where pH meter probe was immersed to determine for pH at room temperature and after sunlight exposure period.

Acidity

10 mL of diluted product were titrated (10% solution of the sample with deionized water) with 0.1 N potassium hydroxide, KOH solution until sample reached a pH value between 8.20–8.40 (using a pH meter), corresponding to endpoint of phenolphthalein [25]. When endpoint was attained, it was noted to determine acidity of substance was calculated using the equation:
(1)
N×V×F×Meq/gSample Volume
where
  • V=volume of potassium hydroxide (KOH),

  • N= Normality of KOH,(0.1N)

  • F=Nomality correction factor

    Meqg=23.35
  • Sample volume= 10 mL

Specific gravity

The density bottle was pre-cleaned and dried using a desiccator and weighted to constant weight. Distilled water was poured into density bottle and weighed; thereafter it was poured out and rinsed with ethanol. The carbonated sample was poured into density bottle and weighed to determine specific gravity as shown below:
(2)
Mass of carbonated sampleMass of distilled water

Total soluble solid content (TSSC)

TSSC was determined using Atago refractometer using a Brix scale to access percentage of sugar or solids dissolved in sample solution measured in g/100 mL [26].

Contamination factor and pollution load index

The contamination factor, CF was calculated to reveal the extent of antimony contamination in samples, while pollution lead index entails the comparative means to assess the total level of antimony contaminant due to different storage time [27].
(3)
CF=CsCr
where,
  • Cs=Concentration of Sb (mg/L)

  • Cr=Reference standards,WHO=0.2 mg/L [28]

The mathematical expression = CF≤ lower contamination, 1<moderate, 3<considerable, 6≥CF, high contamin [27].
(4)
PLI=(CF1×CF2××CFn)1/n
where,
  • CF1=Contamination Factor of each storage time

  • n=number of storage time assessed

Risk assessment

Risk assessments were conducted to estimate the risk associated with estimated daily intake (EDI) and chronic daily intake (CDI) from antimony (Sb) exposure (ingestion or consumption) on adults and children across three exposure periods: acute (≤14 days), intermediate (15–364 days), and chronic (≥365 days) [29].
The estimated daily intake was calculated using method by Lorenc et al. [30].
(5)
EDIingestion=Cs×DCBW
where
  • Cs= Concentration of Sb (mg/L)

  • IRS=Daily Consumption= 0.6Lday, (1 bottles per days)–for adults,1.20 L/day,(2 bottles per days)–for children

  • BW=Body weight=(70 kg for adults; 15 kg for children)

The IRS was determined from on-the-spot assessment, where in a survey was created that invariably suggest that children are most likely to consume more than one bottle than adults. Estimated daily intake were used to assess the short-term consumption risk using Tolerance Dose Index, TDI (mg/kg/day): 0.006 mg/kg/day (No Observed Adverse Effect Level, NOAEL) [28].
The chronic daily intake was calculated for ingestion is [31,32]:
(6)
CDIingestion=Cs×IRS×EF×ED×CFBW×AT
where
  • Cs= Concentration of Sb (mg/L)

  • IRS=Daily Consumption=0.6 L/day,1 bottles per days – for adults,1.20 L/day,2 bottles per days–for children)

  • EF=Exposure frequency= 350 days/year

  • ED=Exposure duration=26 years for adults and 6 years for children

  • CF=Conversion factor=1×10⁻⁶kg/mg,

  • BW=Body weight=(70 kg for adults; 15 kg for children)

  • AT=Average time=(non–carcinogenic=ED×365days; carcinogenic=70×365).

After calculating chronic daily intake, non-carcinogenic risk assessment was conducted to determine the hazard index over a long consumption period as shown in Equation (6) as carcinogenic risk assessment cannot be done due to “inadequate information and lack of data to assess carcinogenic potential” by oral route of exposure in humans [3234].
(7)
Hazard Index =CDIingestionRfD
where,
  • Hazard index acceptable value=HI<1

  • RfD, reference dose (mg/kg/day) =0.0004 (IRIS) [35]

Statistical analysis

Microsoft Excel 2019 was used to assess different statistical analysis with XReal stats add-ins package for Windows. The effect of storage condition (room temperature and sunlight) and storage time (0,3,6,9, 12 and 15 weeks) were analyzed using principal component analysis, cumulative variance and two-way analysis of variance (ANOVA) where factors (antimony leaching, pH, TSSC, acidity and specific gravity) were tested using storage duration performed at p-value=0.05 significant level.

Results and Discussion

Qualitative parameters

Carbonated beverages comprising of eight different brands were used in the study to evaluate the physiochemical composition in two exposure period and time (room temperature and sunlight). The figures are incorporated with up-bar (red color) and down-bar (green color for room temperature and sunlight exposure respectively).

Effect of storage time and exposure in antimony (Sb) concentration in carbonated beverages

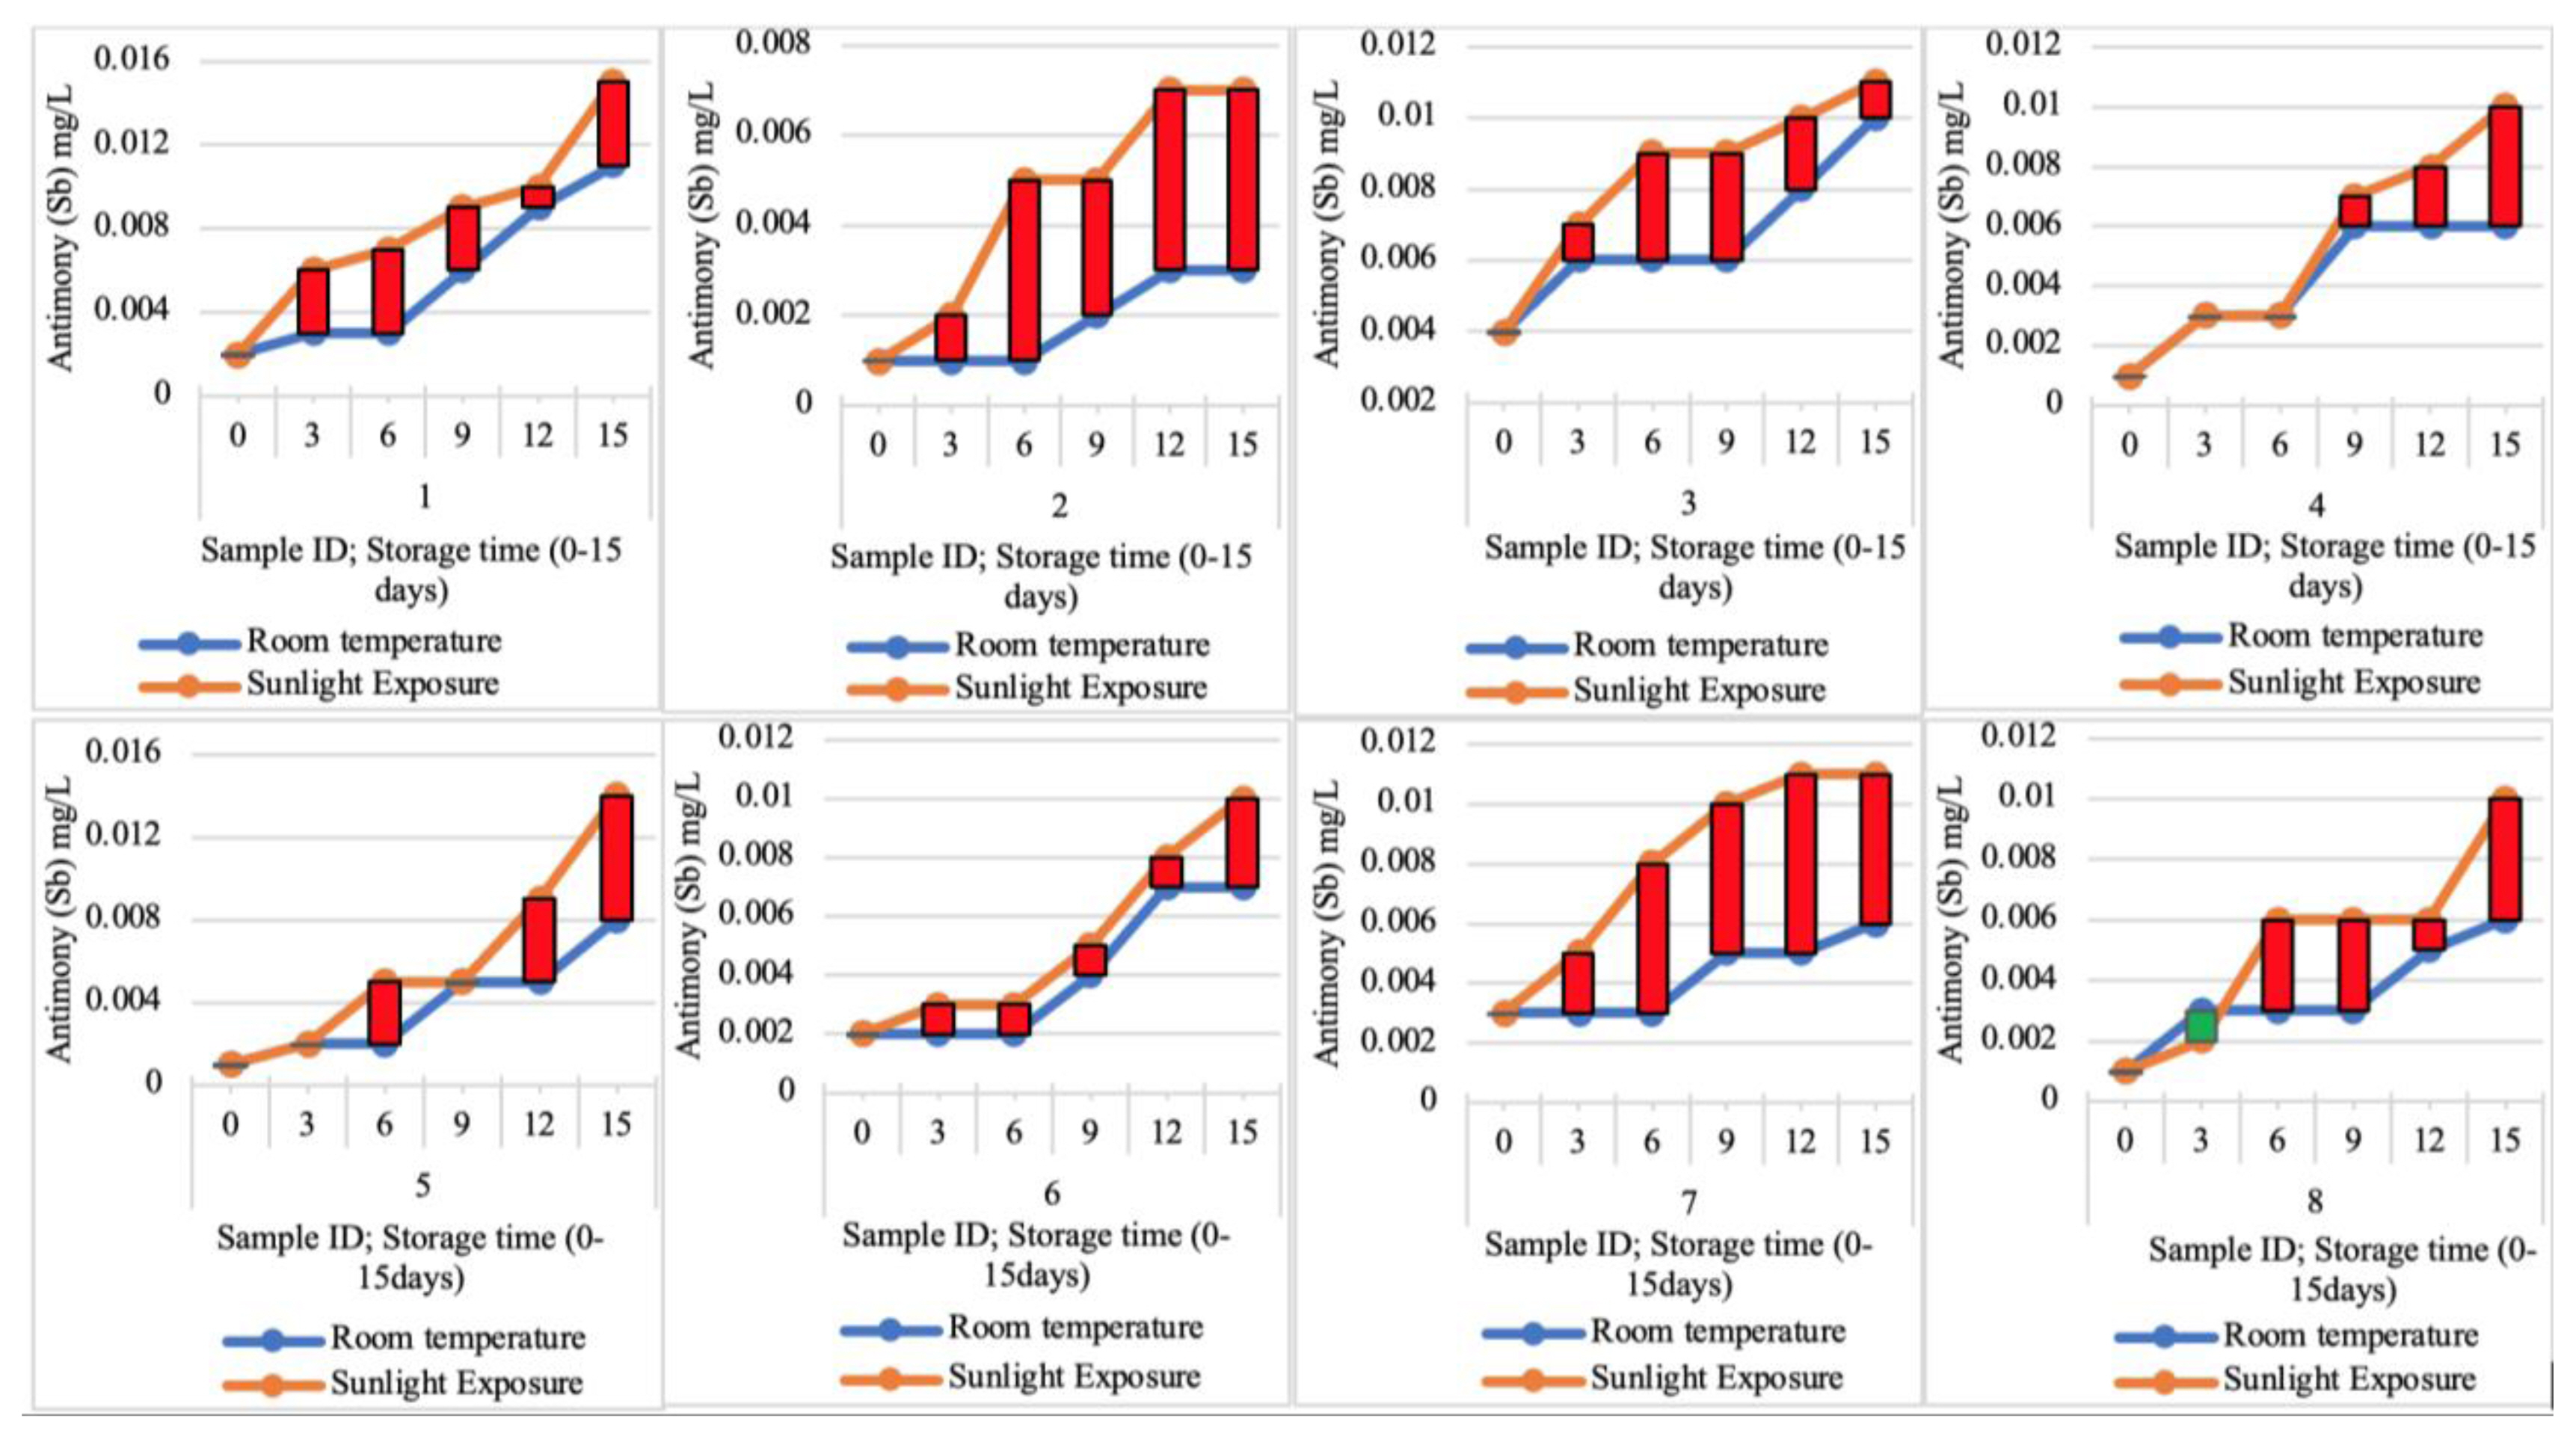
Figure 1 shows the concentration level of antimony on selected carbonated beverages. Figure 1a–d illustrates the change in antimony (Sb) concentration for Coca-Cola, Lacasera apple, Swan orange and Pepsi cola were initially 0.002 mg/L, 0.001 mg/L, 0.004 mg/L, 0.001 mg/L and changed to 0.011 mg/L, 0.003 mg/L, 0.01 mg/L, 0.006 mg/L (room temp.) and 0.015 mg/L, 0.007 mg/L, 0.011 mg/L, 0.01 mg/L (sunlight) after the 15 weeks of storage. This increase was tested statistically at both storage conditions and different storage times as the change in Sb of Coca-Cola was significant (p<0.05) between (0–9, 0–12, 0–15, 3–12, 3–15, 6–15 and 9–15) weeks of storage. Lacasera apple was not significant. For Swan Orange was statistically significant (p<0.05) between (0–12 and 0–15) weeks of storage. Pepsi cola was significant between (0–9, 0–12, 0–15, 3–15 and 6–15) weeks of storage. Figure 1e–h shows the change in Antimony of Fanta orange, Mirinda-pineapple, Mirinda orange and Teem lemon were initially 0.001, 0.002, 0.003, 0.001, which changed to 0.008, 0.007, 0.006 and 0.006 (room temp.) and 0.014, 0.01, 0.011, 0.01 (sunlight) respectively after 15 weeks of storage. ANOVA Significance tested shows Fanta Orange and Mirinda Orange was not significant. For Mirinda Pineapple was not significant (p< 0.05) between (0–12, 0–15, 3–12, 3–15, 6–12, 6–15, 9–12 and 9–15) weeks of storage. Team Lemon was found to be statistically significant between 0–15 weeks of storage.
The concentration of antimony (mg/L) was higher under sunlight exposure compared to room temperature, as the dissolution increases with time, which was in agreement with Ali et al. [37]. Chapa-Martínez et al. [19] reported that storage mode has significant impact to antimony leaching [19]. Bach et al. reported that presence of carbon dioxide increases antimony release [10]. Nawrocket et al. [38] reported high dissolution of carbonyl compounds from PET bottles as elevated temperature do not promote chemical migration, but leads to degradation of plastics materials from sunlight ionization [38]. So therefore, the quality of chemical raw materials and additives in manufacturing these PET bottles, the content in these bottles (carbonated or non-carbonated), storage conditions and exposure matrices, can influence the rate of thermal degradation, chemical reactions. Thus, this confirms why beverage manufacturers in Nigeria use expiry dates between 6–8 months to prevent chemical dissolution due to different exposure mediums.

Effect of storage time and exposure on pH levels in carbonated beverages

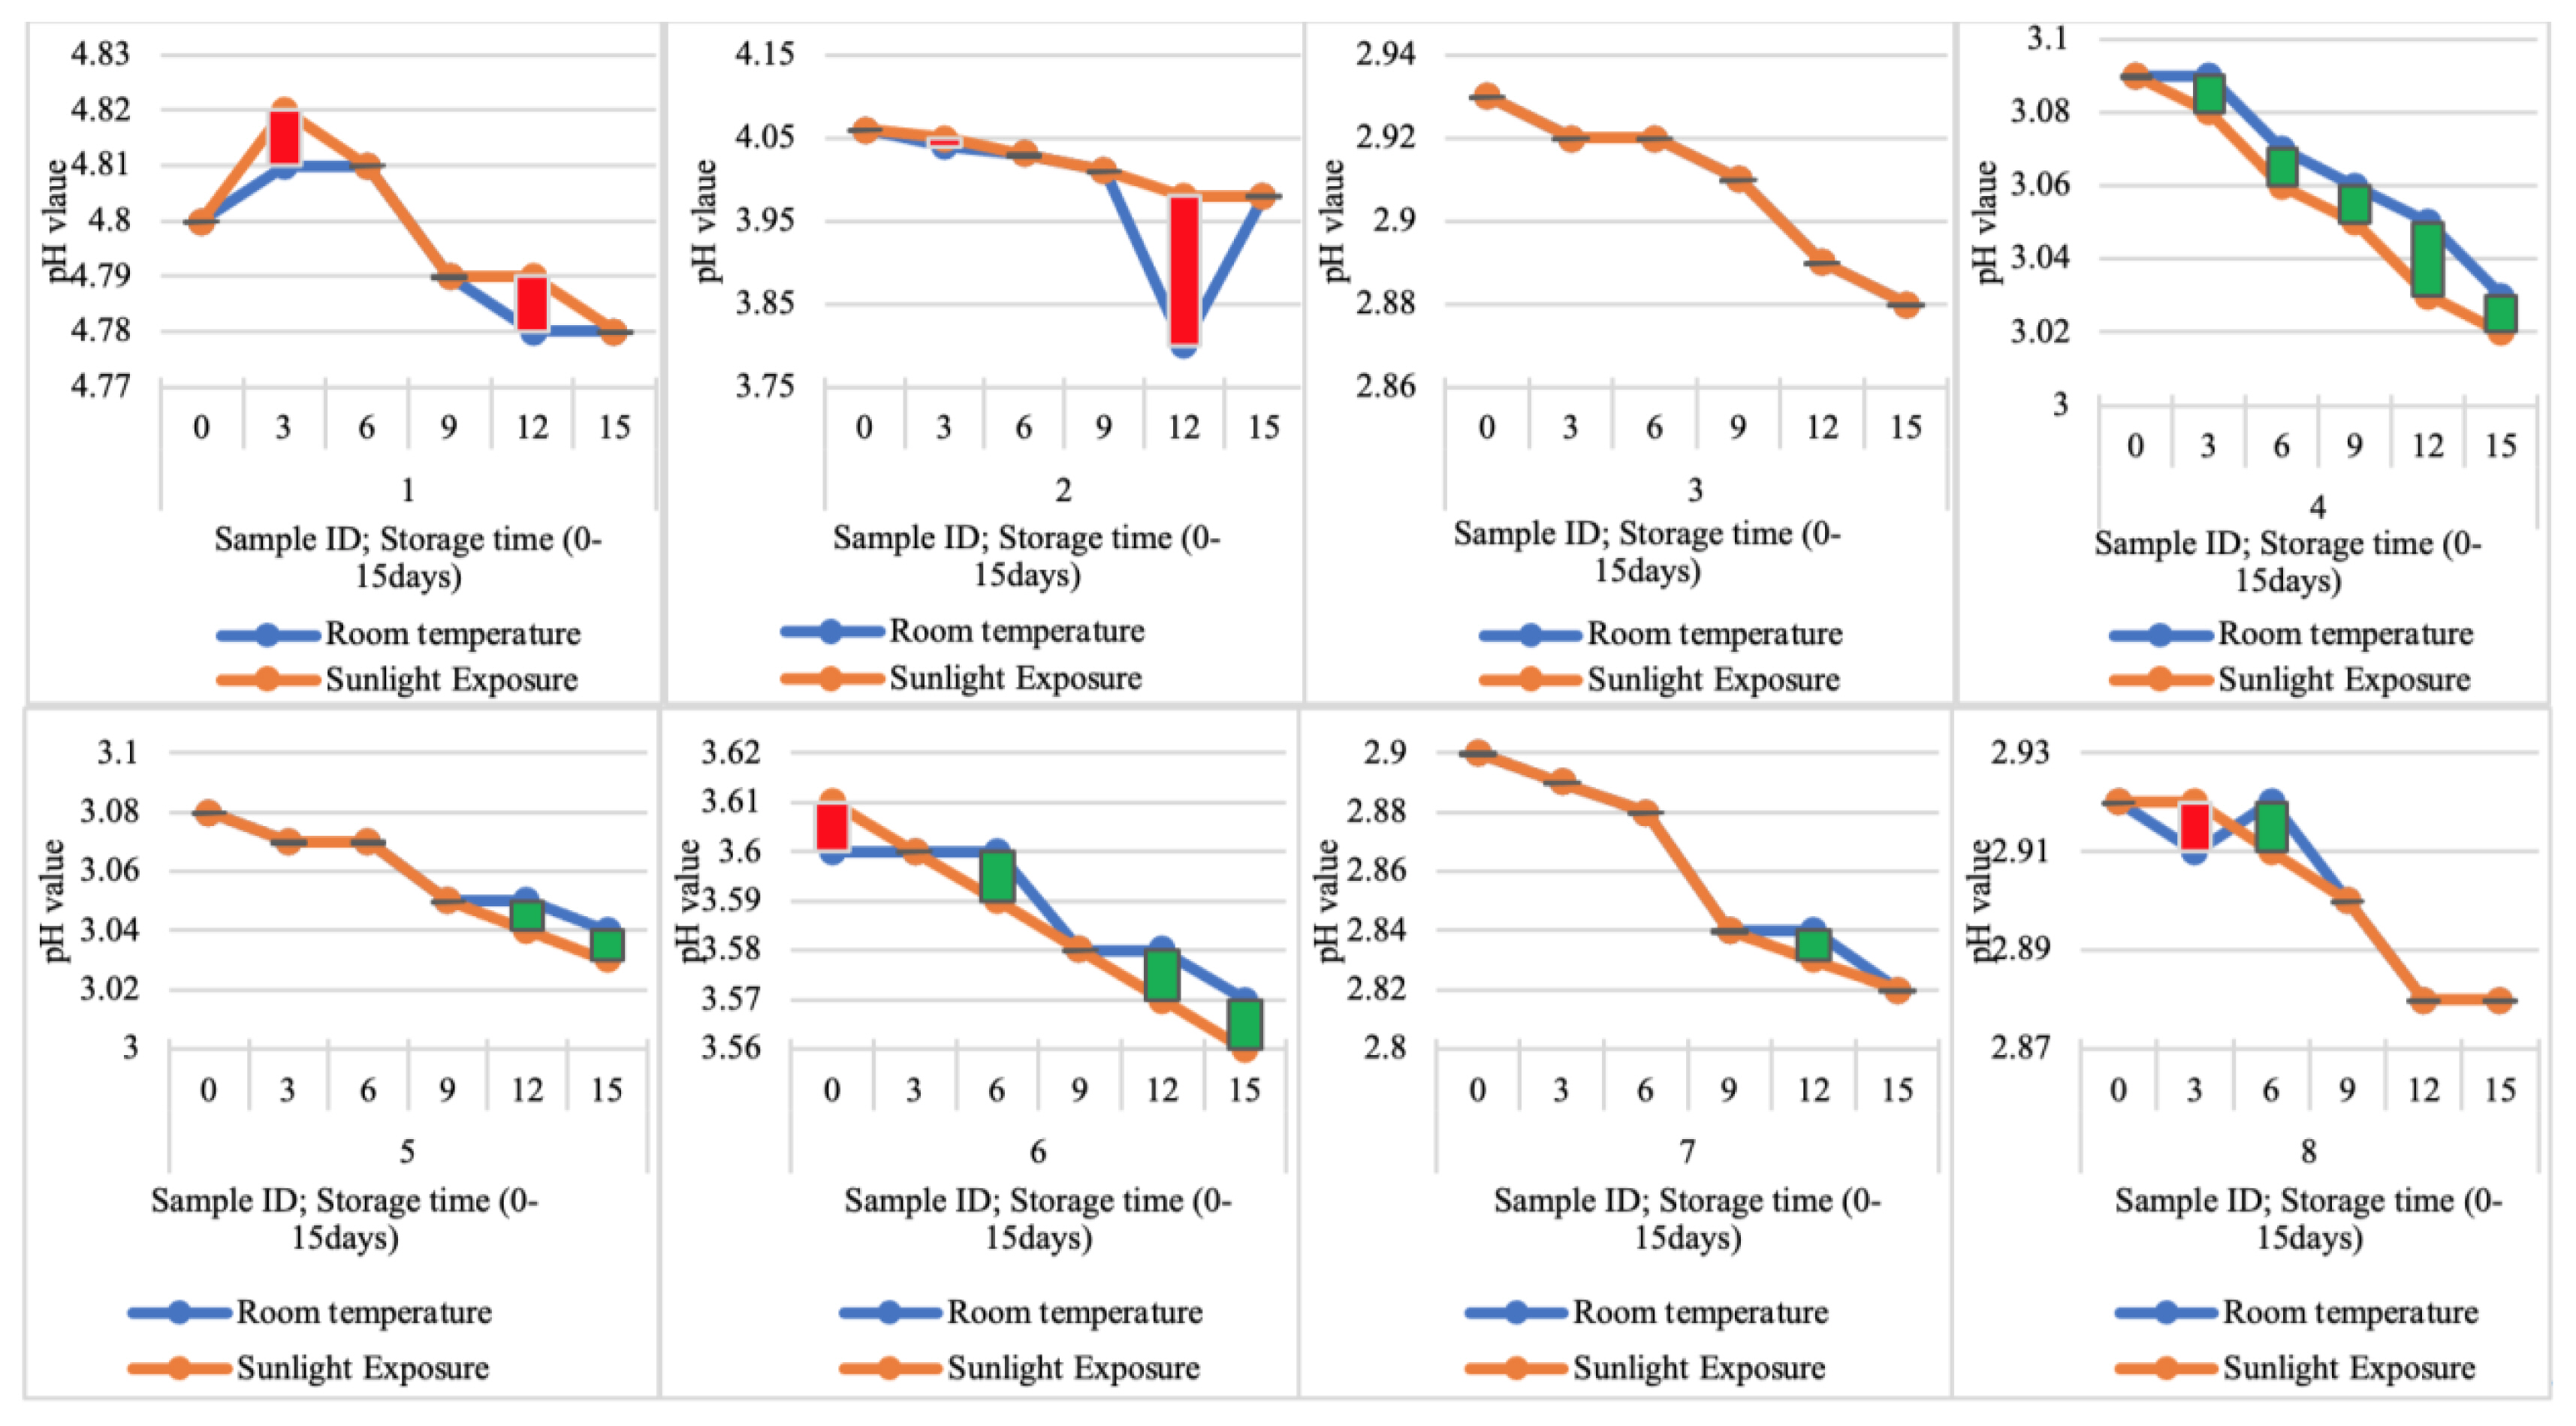
Figure 2 shows the pH level from influence of storage time and exposure in different carbonated beverages. Figure 2a–d reveals the pH changes for Coca-Cola, Lacasera apple, Swan orange and Pepsi cola had initial pH of 4.80, 4.06, 2.93, 3.09, which changed to 4.78, 3.98, 2.88, 3.03 (room temp.) and 4.78, 3.98, 2.88, 3.02 (sunlight) after 15 weeks of storage. This change was tested statistically at both storage conditions and different storage times showed that Coca-Cola was significant (p<0.05) between (0–15, 3–9, 3–12, 3–15, 6–9, 6–12, 6–15) weeks of storage. Lacasera apple was not significant via different conditions and storage time. Swan Orange was significant (p<0.05) under all conditions and storage time. Pepsi cola was significant between (0–6, 0–9, 0–12, 0–15, 3–6, 3–9, 3–12, 3–15, 6–12, 6–15 and 9–15) weeks of storage. Figure 2e–h reveals pH change for Fanta orange, Mirinda-pineapple, Mirinda orange and Teem lemon had initial pH of 3.08, 3.60, 2.90, 2.92, which changed to 3.04, 3.57, 2.82, 2.88 (room temp.) and 3.03, 3.56, 2.82, 2.88 (sunlight) respectively after 15 weeks of storage. Fanta Orange was significant between (0–9, 0–12, 0–15, 3–9, 3–12, 3–15, 6–9, 6–12 and 6–15) weeks of storage. Mirinda Pineapple was significant (p<0.05) between (0–9, 0–12, 0–15, 3–9, 3–12, 3–15, 6–12 and 6–15) weeks of storage. Mirinda Orange was significant (p< 0.05) between (0–6, 0–9, 0–12, 0–15, 3–9, 3–12, 3–15, 6–9, 6–12, 6–15, 9–15 and 12–15) weeks of storage. Team Lemon was statistically significant (p< 0.05) between (0–9, 0–12, 0–15, 3–12, 3–15, 6–12, 6–15, 9–12 and 9–15) weeks of storage.
pH is an important quality that describes the stability of bioactive compounds in carbonated beverages [39]. It was observed that the pH of the studied samples decreased with time except for Sample 1 (Coca-Cola) which slightly increased before decreasing. This gradual decrease in pH has a significant effect, as a lower pH does not allow pathogenic microorganisms to grow and hence acts as a preservative [40]. Similar trends were reported by Hamaran and Amutha [41] in study of banana and sapota beverage stored at different temperatures for 180 days [41]. The observed increase in acidity of the beverages may be because of the presence of carbon dioxide (CO2) and acidity regulators present in beverages [40]. These acidity regulators are added to beverage to improve their taste and as well act as a preservative.

Effect of storage time and exposure on TSSC levels in carbonated beverages

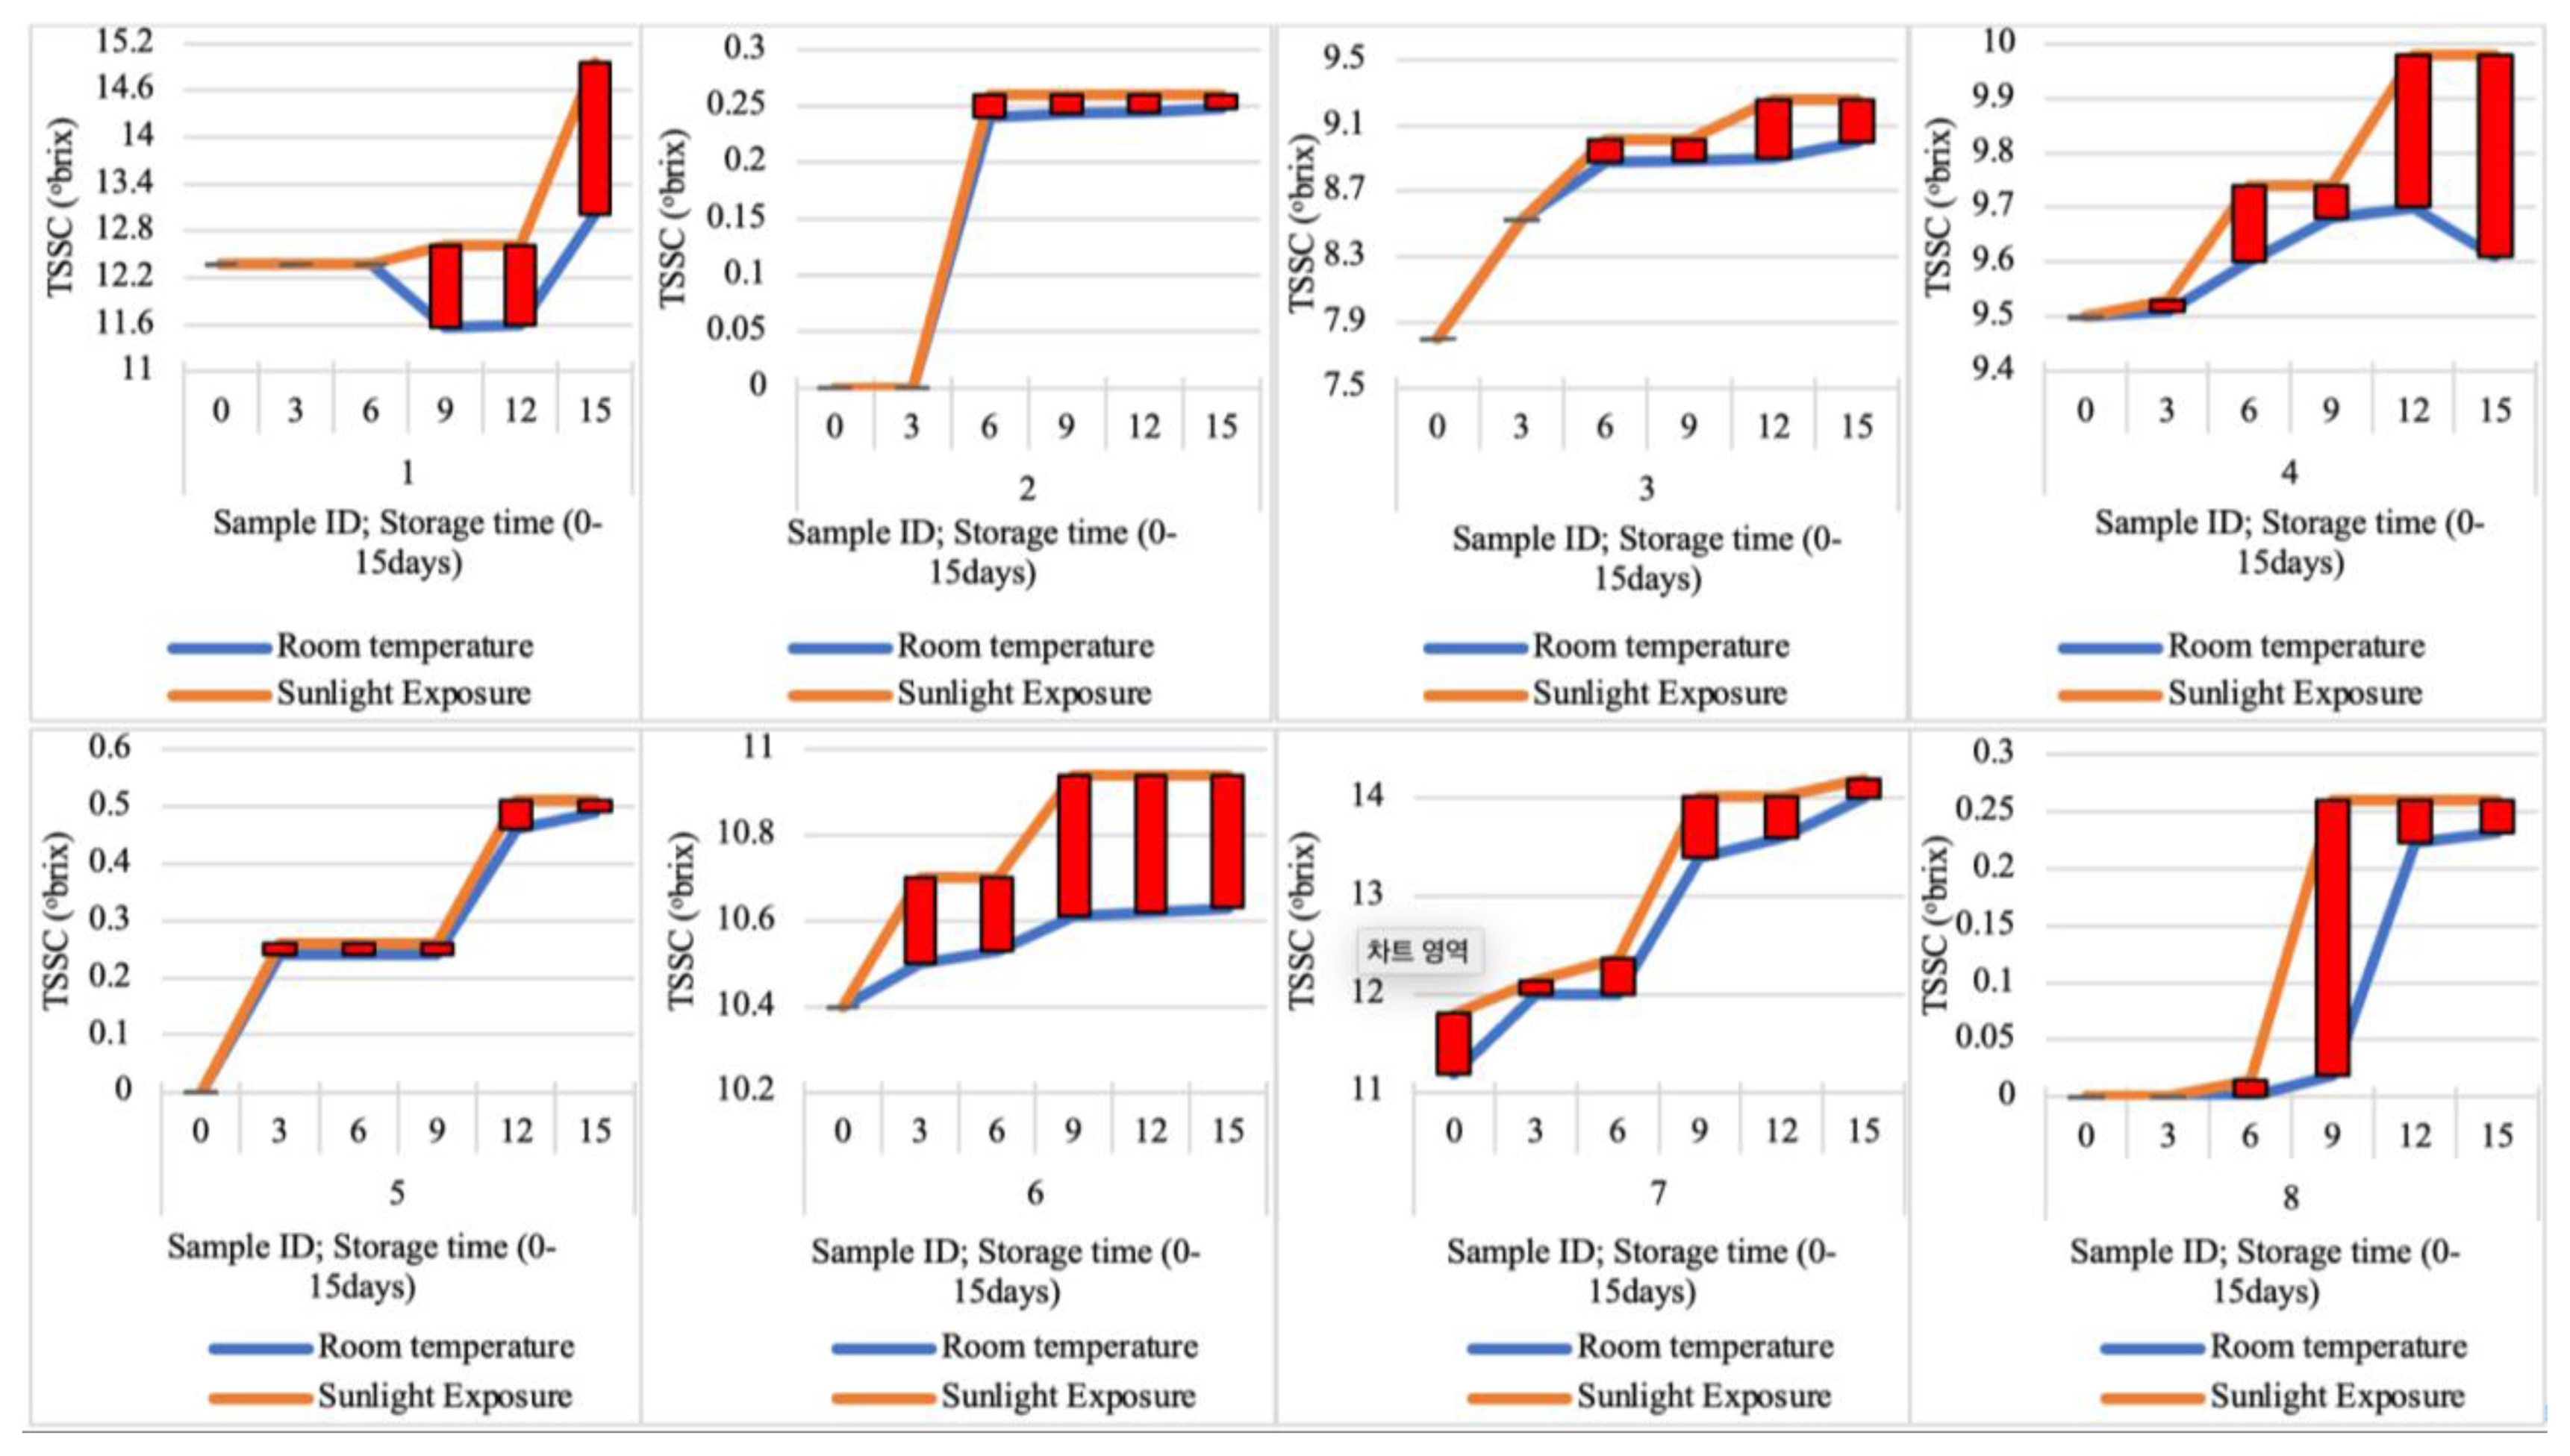
Figure 3 shows the total soluble solid content (TSSC) of carbonated beverages. Figure 3a–d reveals that Coca-Cola, Lacasera apple, Swan orange and Pepsi cola had initial TSSC of 12.37, 0.00, 7.80, 9.50, which changed to 13.01, 0.248, 9.00, 9.61 (room temp.) and 14.96, 0.26, 9.26, 9.98 (sunlight) after 15 weeks of storage. The change was tested statistically at both storage conditions and different storage times, where Coca-Cola and Pepsi cola was not significant at p>0.05. Lacasera apple was statistically significant (p< 0.05) between (0–6, 0–9, 0–12, 0–15, 3–6, 3–9, 3–12 and 3–15) weeks of storage. Swan orange was statistically significant (p< 0.05) between (0–3, 0–6, 0–9, 0–12, 0–15, 3–12 and 3–15,) weeks of storage. Figure 3e–h reveals TSSC change for Fanta orange, Mirinda-pineapple, Mirinda orange and Teem lemon with initial TSSC of 0.00, 10.40, 11.18, 0.00 that changed to 0.49, 10.63, 14.00, 0.231 (room temp.) and 0.51, 10.94, 14.20, 0.26 (sunlight) respectively after 15 weeks of storage. Significant change (p<0.05) was observed in Fanta orange between (0–3, 0–6, 0–9, 0–12, 0–15, 3–12, 3–15, 6–12, 6–15, 9–12 and 9–15) weeks of storage. Miranda-pineapple was not significant. Mirinda orange was statistically significant (p<0.05) between (0–6, 0–9, 0–12, 0–15, 3–9, 3–12, 3–15, 6–9, 6–12 and 6–15) under different conditions and different storage time. Teem was not significant under different storage conditions and different storage time.
It was observed that the TSSC of the samples increased with time in all the samples studied from chemical additives side reaction. The increase in TSSC might be due to the conversion of insoluble polysaccharides into reducing sugars [40]. It may also be because of the hydrolysis of sugars by acids, which might have resulted in the degradation of disaccharides to monosaccharides [12]. Another possible reason for the increment in soluble solids content may be due to the hydrolysis of sucrose to reverse sugars into monosaccharides [42]. Increased TSSC contents with storage period is in correlation with the findings of Sirohi et al. [43] who observed similar increased TSSC in Whey-based mango herbal mint beverage during storage and attributed to the solubilization the insoluble portion of the product due to the presence of acids (ascorbic and citric acid) in mint and ginger [43].

Effect of storage time and exposure on acidity levels in carbonated beverages

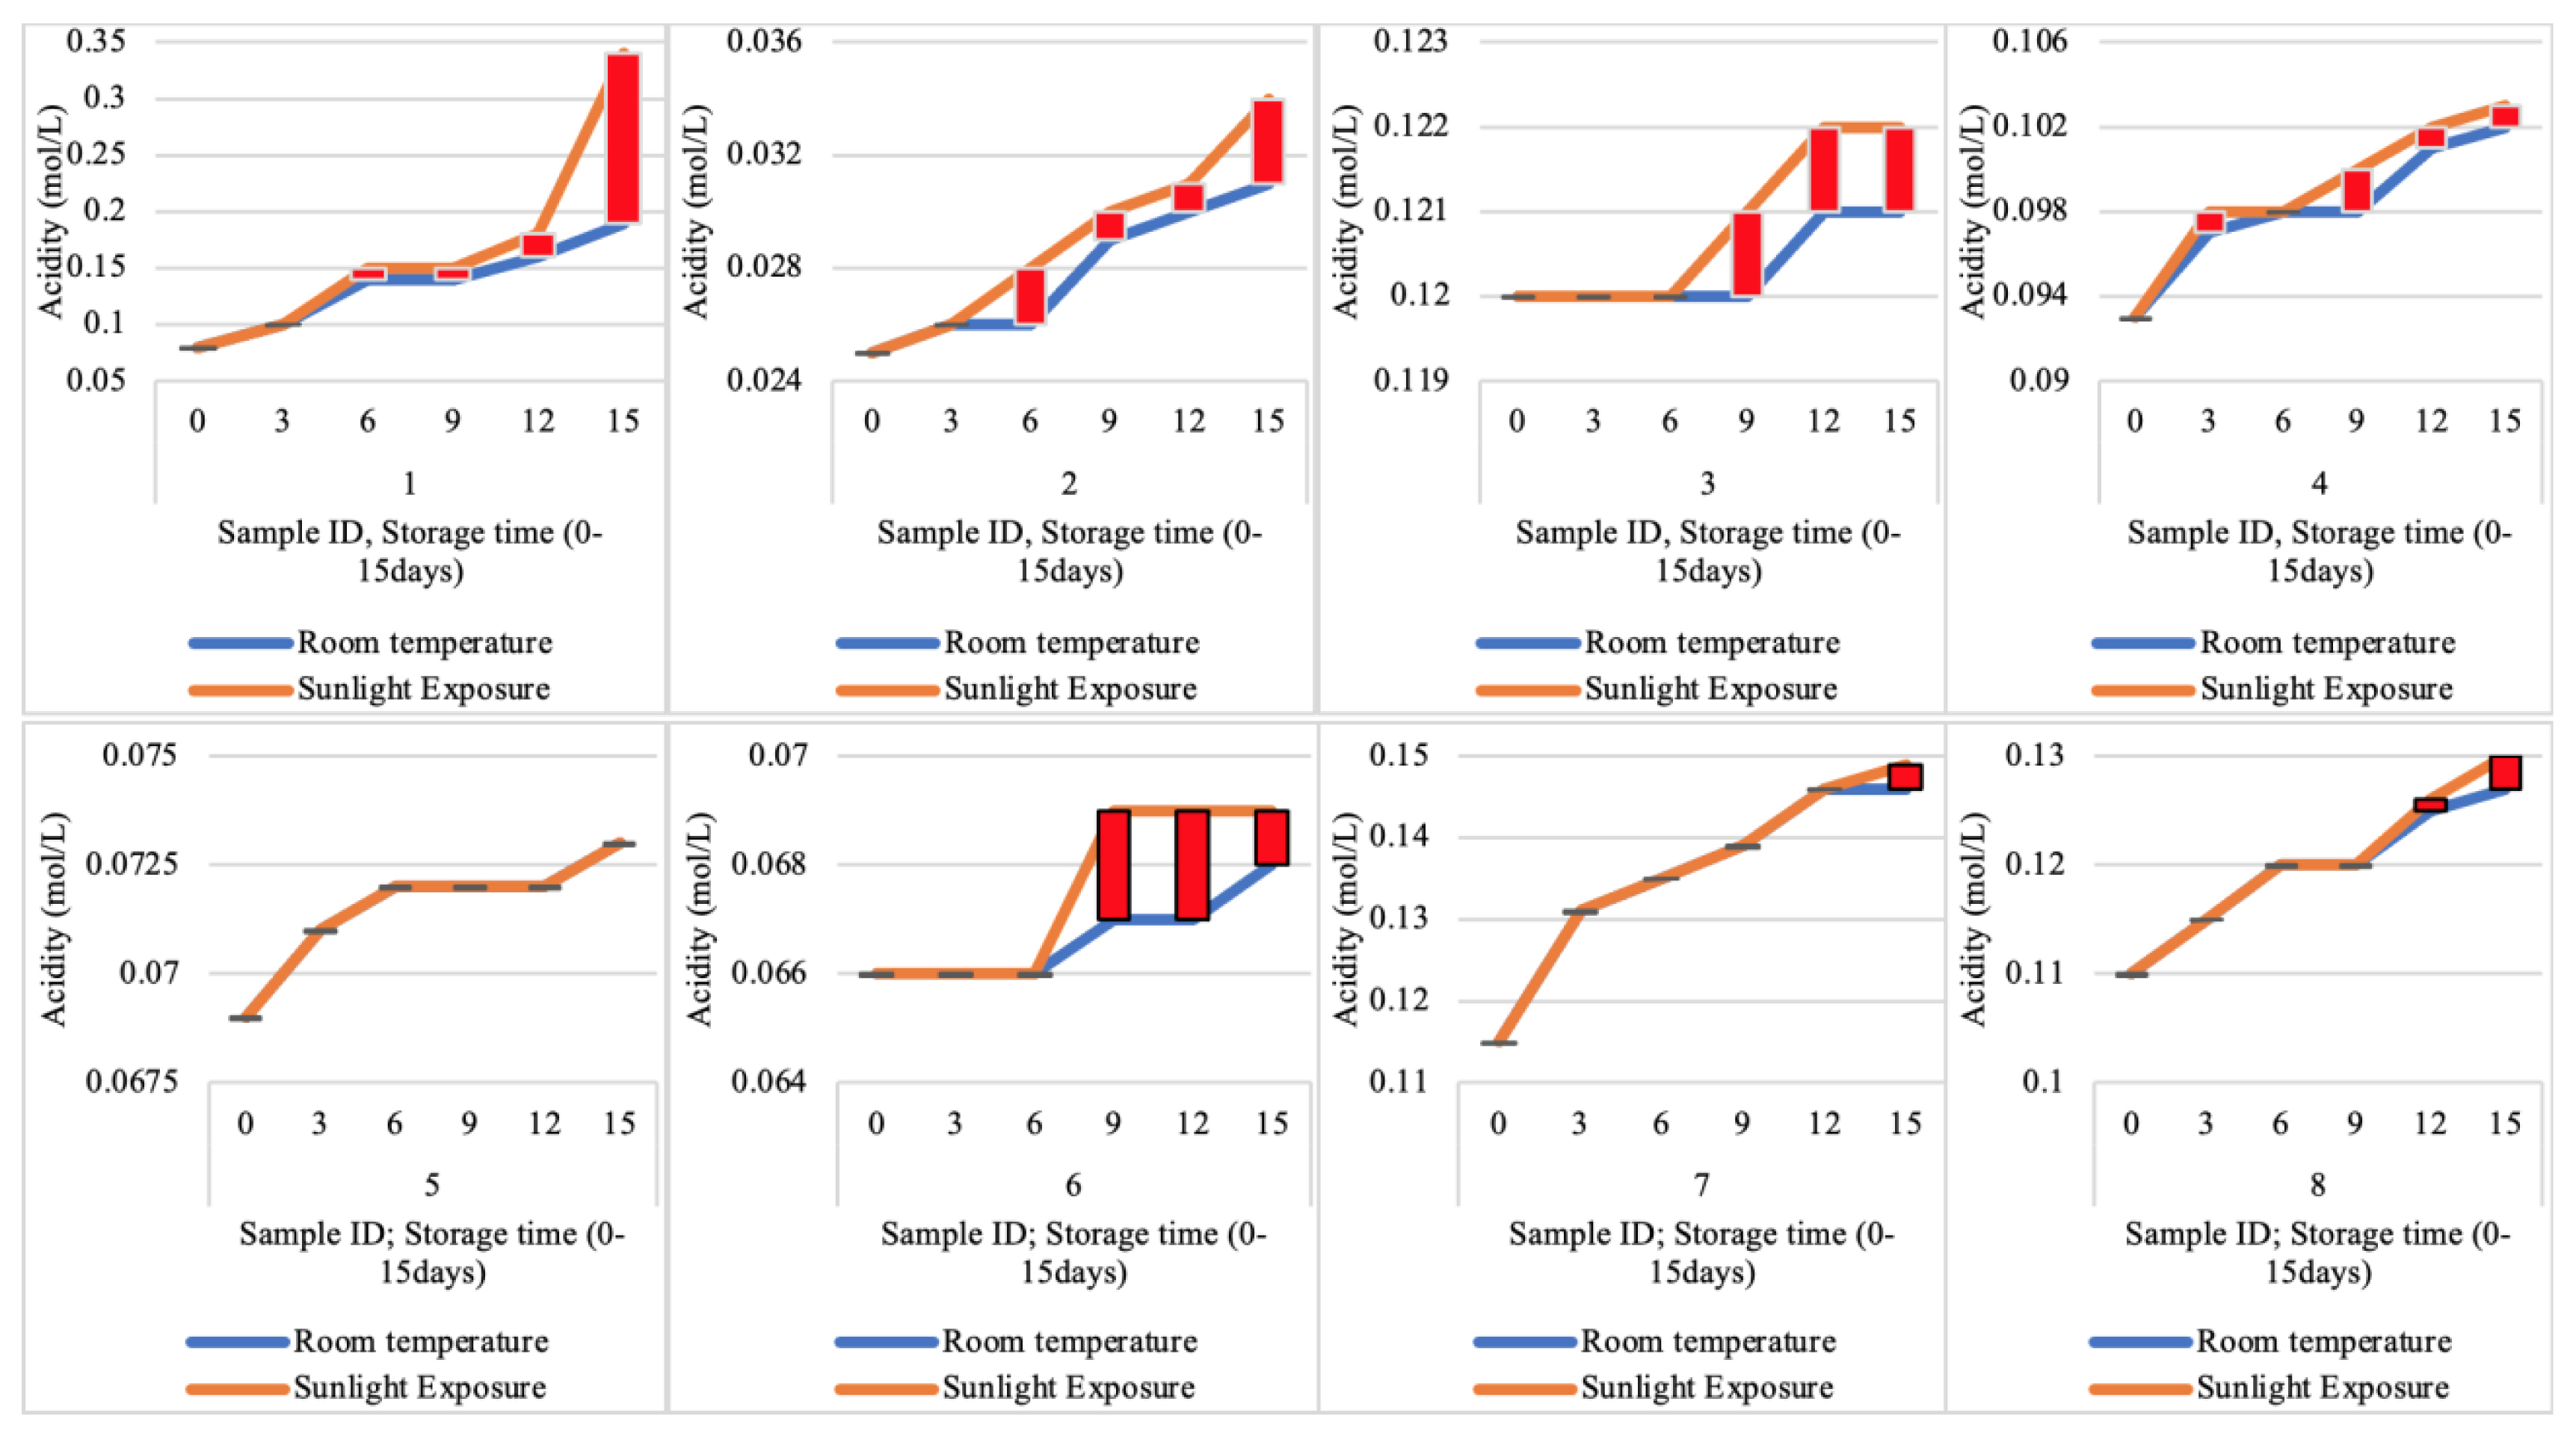
Figure 4 shows the acidity content of carbonated beverages. Figure 4a–d reveals the acidity level for Coca-Cola, Lacasera apple, Swan orange and Pepsi cola were initially 0.08, 0.025, 0.12, 0.093 and changed to 0.19, 0.031, 0.121, 0.102 (room temp.) and 0.34, 0.034, 0.122, 0.103 (sunlight) respectively. Coca-Cola and Swan orange was not statistically significant (p>0.05) under different storage conditions and time. Lacasera apple was significant between (0–9, 0–12, 0–15, 3–12, 3–15 and 6–15) weeks of storage. Pepsi cola was significant (p< 0.05) between (0–3, 0–6, 0–9, 0–12, 0–15, 3–12, 3–15, 6–12, 6–15, 9–12 and 9–15) of storage. Figure 4e–h reveals that the acidity level for Fanta orange, Mirinda-pineapple, Mirinda orange and Teem lemon were initially 0.069, 0.066, 0.115, 0.11 and changed to 0.073, 0.068, 0.146, 0.127 (room temp.) and 0.073, 0.069, 0.149, 0.13 (sunlight) respectively. The change in acidity of Fanta orange was statistically significant (p<0.05) between (0–3, 0–6, 0–9, 0–12, 0–15, 3–6, 3–9, 3–12, 3–15, 6–15 and 12–15) weeks of storage under different conditions. There was no significant change in Mirinda pineapple. Mirinda orange was significant (p<0.05) at different storage condition and storage time except 12–15 weeks of storage. Teem lemon was significant (p<0.005) between (0–3, 0–6, 0–9, 0–12, 0–15, 3–6, 3–9, 3–12, 3–15, 6–12, 6–15, 9–12 and 9–15) weeks of storage.
It was observed that acidity level (citric acid) increased with increase in storage time in all the samples studied. The acidity value observed in Coca-Cola was 0.008–0.202. Figure 4e showed that there was no noticeable change between the room temperature and sunlight exposed samples after 15 weeks of storage. While in Figure 4g and 4h showed no change between the two storage conditions until 12th week of storage. The increase in acidity is due to the presence of carbon dioxide (CO2), citric acid and other acid regulators purposely added to the beverages at the time of preparation. Similar trends were reported by Hamaran and Amutha [41], who observed an increase in acidity of banana and sapota beverage stored at ambient conditions (35–36 °C) and low temperature (3–5 °C) [41]. These additives are added to beverages to improve flavor, taste and act as preservative, enhances as beneficial antioxidant and add aroma [40].

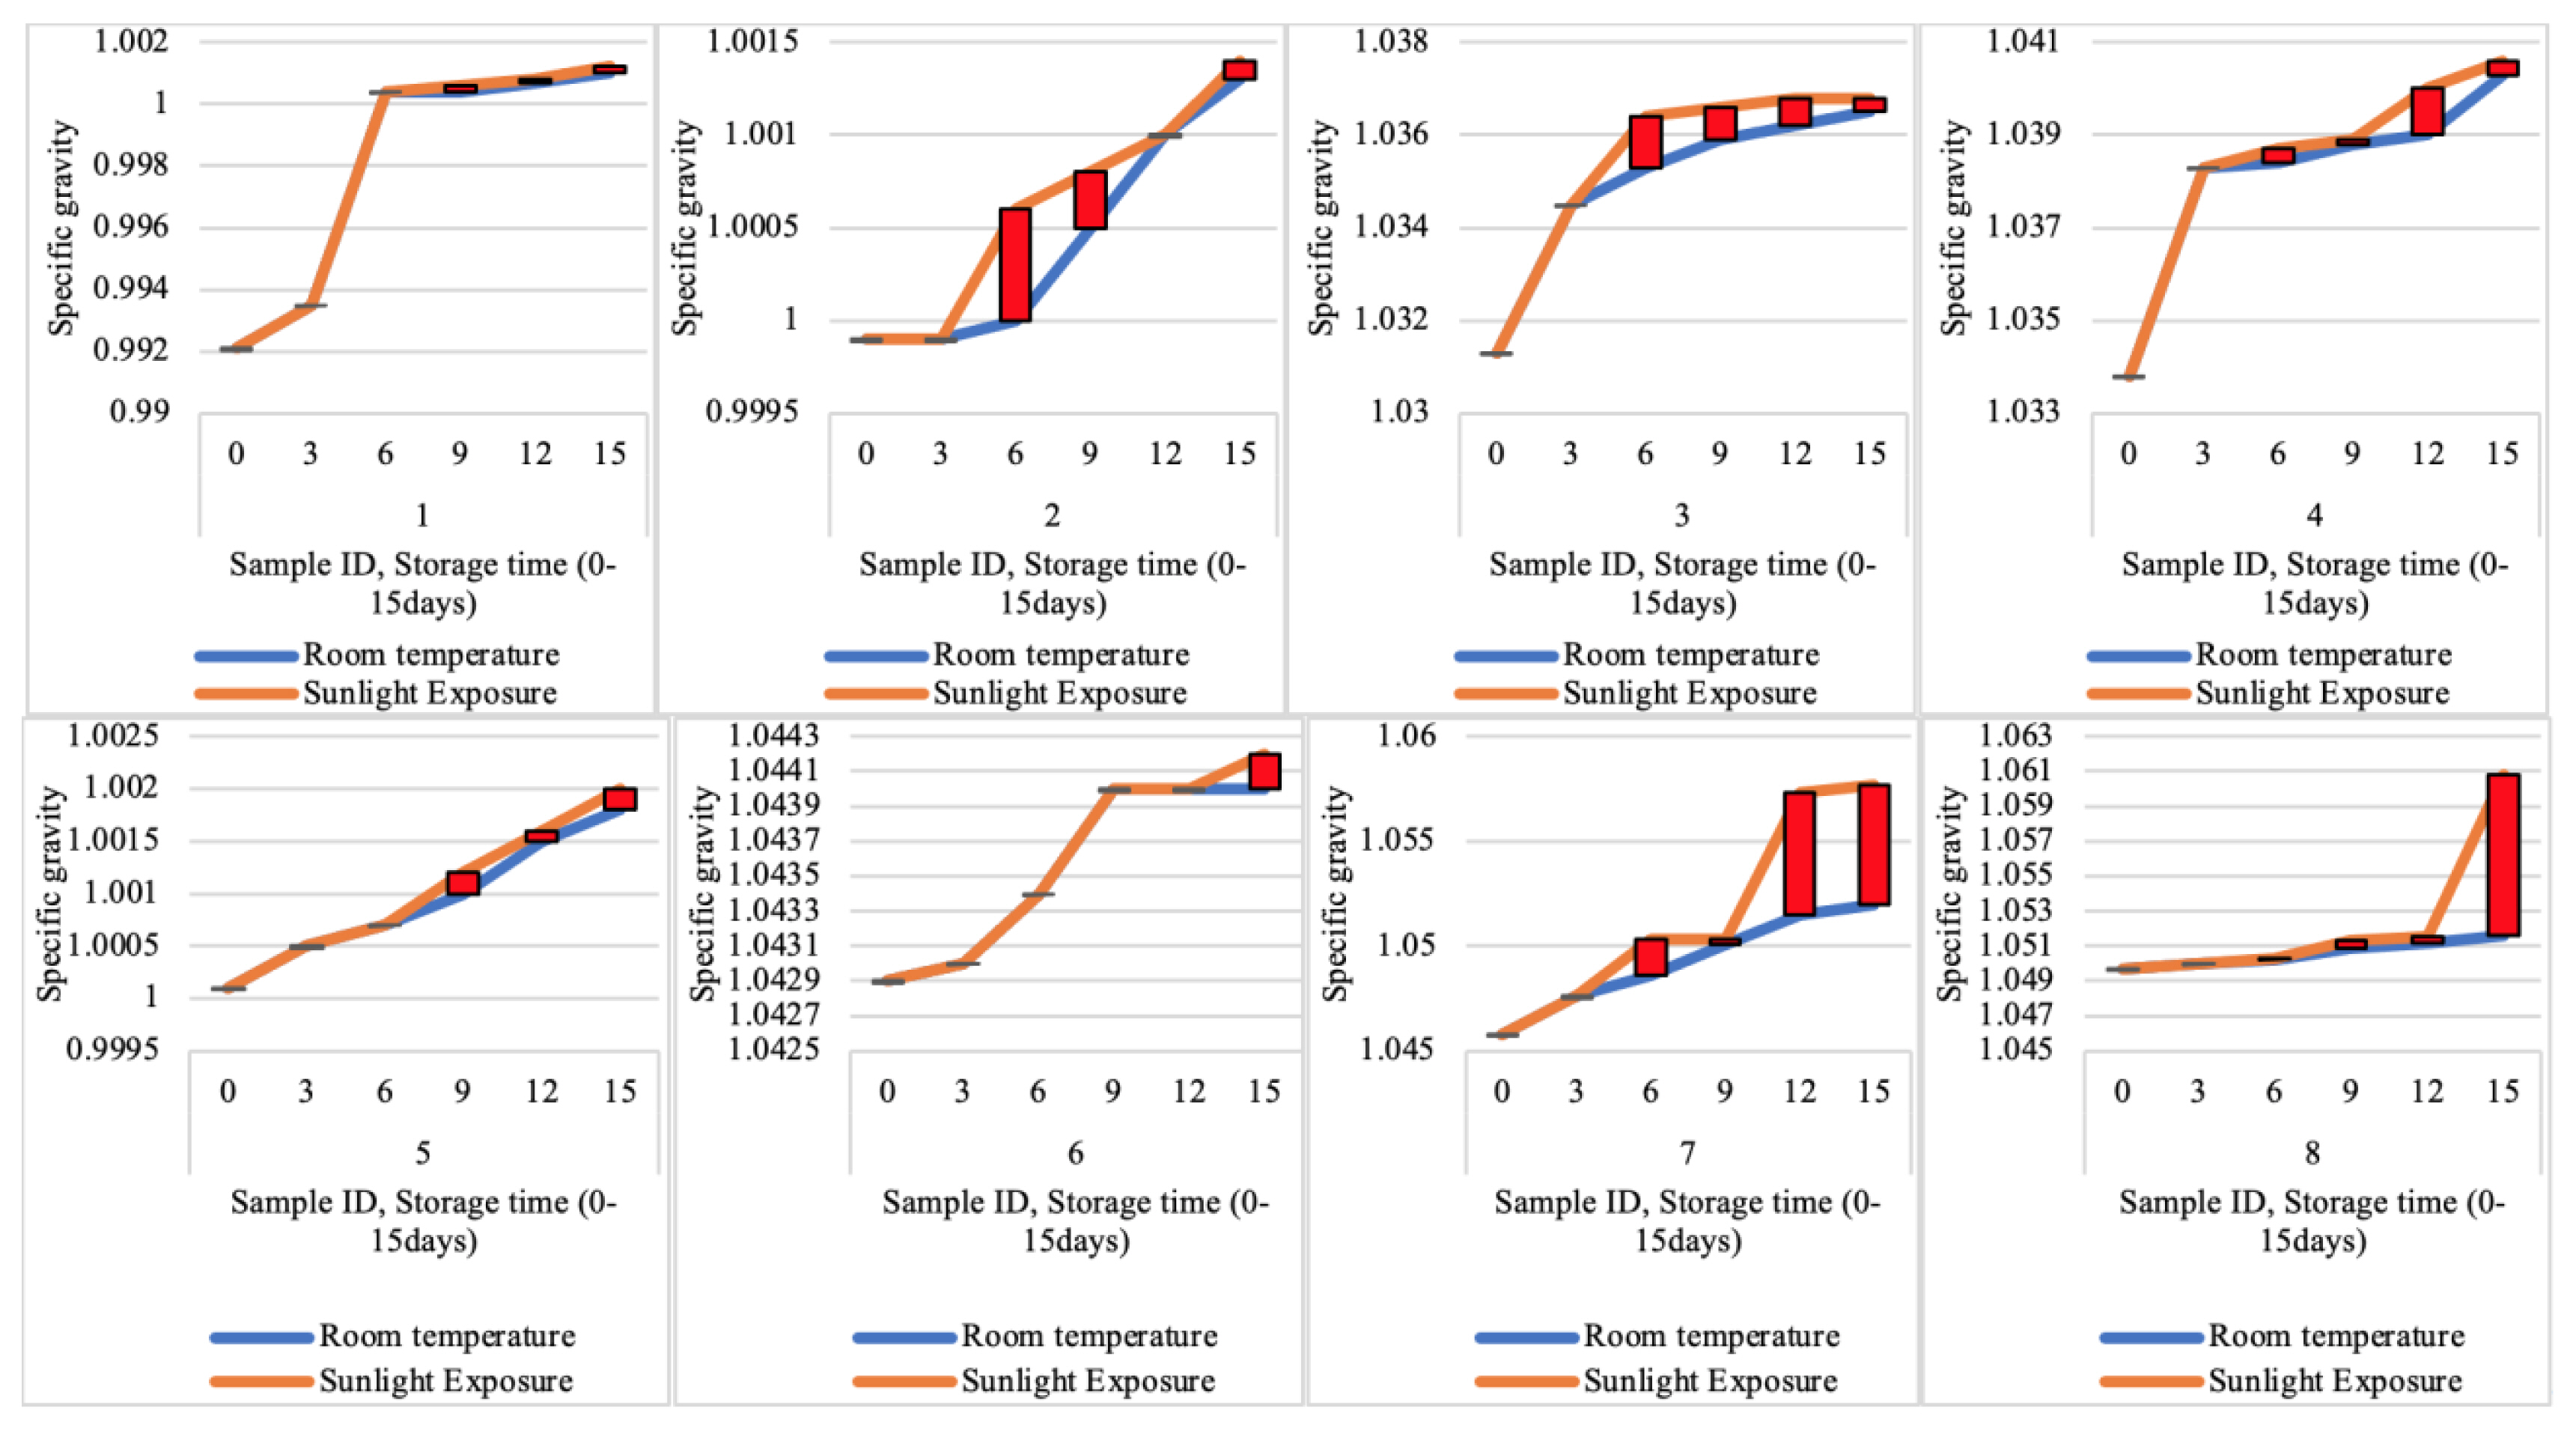
Effect of storage time and exposure of specific gravity in carbonated beverages

Specific gravity (SG) for Coca-Cola, Lacasera apple, Swan orange, Pepsi cola, Fanta orange, Mirinda-pineapple, Mirinda orange and Teem lemon presented in Figure 5. Initial SG was 0.992, 0.999, 1.031, 1.034, 1.000, 1.043, 1.046, 1.049, and changed to 1.001, 1.001, 1.037, 1.04, 1.002, 1.044, 1.052, 1.052 (room temp.) and 1.001, 1.001, 1.037, 1.041, 1.002, 1.044, 1.058 and 1.061 (sunlight) respectively after 15 weeks of storage. The change in SG for Coca-Cola was significant between (0–3, 0–6, 0–9, 0–12, 0–15, 3–6, 3–9, 3–12 and 3–15) weeks of storage under different storage conditions. There was no significant change in the SG of Lacasera apple and Teem lemon. Swan orange was significant between (0–3, 0–6, 0–9, 0–12 and 0–15, 3–15) weeks of storage. Pepsi cola was significant between (0–3, 0–6, 0–9, 0–12, 0–15, 3–12, 3–15 and 6–15) weeks of storage. Fanta orange was significant between (0–3, 0–6, 0–9, 0–12, 0–15, 3–12, 3–15, 6–12; 6–15, 9–12 and 9–15) weeks of storage. Mirinda pineapple was statistically significant between (0–9, 0–12, 0–15, 3–9, 3–12, 3–15, 6–9, 6–12 and 6–15) weeks of storage. Mirinda orange was significant between 0–15 weeks of storage.
The Figures showed that specific gravity increased with time at both storage conditions. The observed increase in specific gravity of the samples may be because of the activities of sugar, which is directly evident by the increase in TSSC contents with storage time. The results of the effects of storage on specific gravity of beverages are in agreement with works elsewhere [8].

Risk assessment

The health risk assessment was conducted using two matrices, estimated daily intake (EDI) and chronic daily intake (CDI) of antimony assessed in beverage based on the storage condition as shown in Table 2. The calculation was centered on onsite specific assumptions that adults and children consumes between 0.6–1.20 L of beverages per day as there may be variation in consumption frequency [31,44]. The Estimated Daily Intake (EDI) and Chronic Daily Intake (CDI) reveals that the value of antimony daily intake for room temperature was lower compared to sunlight exposure and as exposure time increases, the EDI and CDI increases significantly. The Hazard Index (HI) computed using USEPA guidelines as shown in Table 3. Comparing EDI to tolerance dose level as recommended by WHO of 0.006 mg/kg/day [28], the values were within permissible level. Al-Otoum et al. [45] showed that children tend to drink more compared to adults, as seen by impact of bodily weight and taste potential [45]. For the CDI values, USEPA reference value of 0.0004 mg/kg/day was used to assess antimony exposure that invariably implies that the hazard index (HI) below one indicates no health risk [46]. According to International Agency for Research on Cancer [47] and United States Department of Health and Human services-National Toxicology Program [48], antimony is categorized as probable carcinogen (2B), while USEPA has not classified the carcinogenicity of antimony due to lack of human trials and uncertainties [35,36].
The impact of antimony leaching to storage condition (room temperature and sunlight exposure) over increasing storage time has shown that oral exposure to antimony in beverages over a period can lead to short term headaches, anorexia, dizziness, mild inflammation of veins and uvea, [49,50]. For children who continue consuming these beverages in PET bottles until adulthood may experience long-term gastrointestinal effect [51], biochemical and alteration in blood glucose level [29]. Other health effect includes liver and kidney dysfunctions [33].

Contamination factor and pollution level index

Table 4 shows the computed results for antimony CF and PLI in relation to storage time and condition. Sample 1–8 were considerably low in contamination associated to antimony leaching for beverages stored at room temperature, whereas, sunlight exposed sample 1 and 5 will have increasing leaching of antimony over a long period. Special care must be taken from prolong storage conditions and shelf life of beverages to prevent chemical leaching and side reaction from climatic factors such as temperature and humidity. Therefore, after 15th week of beverages storage and consumption by either adults or children, it can lead to bioaccumulation of antimony in the body, which has detrimental impact to health and wellbeing over a long period. The PLI calculated were less than one across the two assessed storage conditions. In increasing order for room temperature were LA < FO < TL < MP < PC < MO < CC < SO and Sample LA < TL < PC < FO < MP < CC < MO < SO for sunlight exposure respectively, thus there is least issues associated to antimony leaching [45].

Principal component analysis

Principal component analysis (factor analysis) were conducted to assess the impact of various variables to extract significant information from absolute values above 0.71 [52]. Table 5 shows factor analysis conducted on different factors in beverages for 15-week storage condition. For sample 1 (CC), room temperature has two factors with 75% cumulative variance, where we can infer that there is strong inter-correlation between storage time (0.983), antimony (0.963), acidity (0.977) and specific gravity (0.822) with Factor 1, compared Factor 2, where total soluble solid content was predominant due to chemical additive solubilization. For sunlight exposure showed that storage time (0.696), antimony (0.970), TSSC (0.858), acidity (0.965), and specific gravity (0.815). Sample 2–8 had one factor matrix across each analysis, as storage time, antimony TSSC acidity and specific gravity were positive which confirms that these parameters has significant impact from climatic and metrological action [29]. pH was negative across all samples, which can be attributed to side reaction such as oxidation, reduction and hydrolysis from chemical additives in the beverages and polymeric reaction with the PET bottles such as cleavage, elimination, rearrangement, cross-linking redox and photo-hydrolysis [53]. Sample 2, 4–6 showed that the cumulative variance of room temperature was higher in comparison to sunlight exposure due to photochemical reaction in the PET bottles [37]. Sample 3, 7 and 8 represented showed reduction in variance as a result of climatic condition or colored material used to produce the PET bottles as we know that light reaction with different color matrix different appreciably [1719,54].

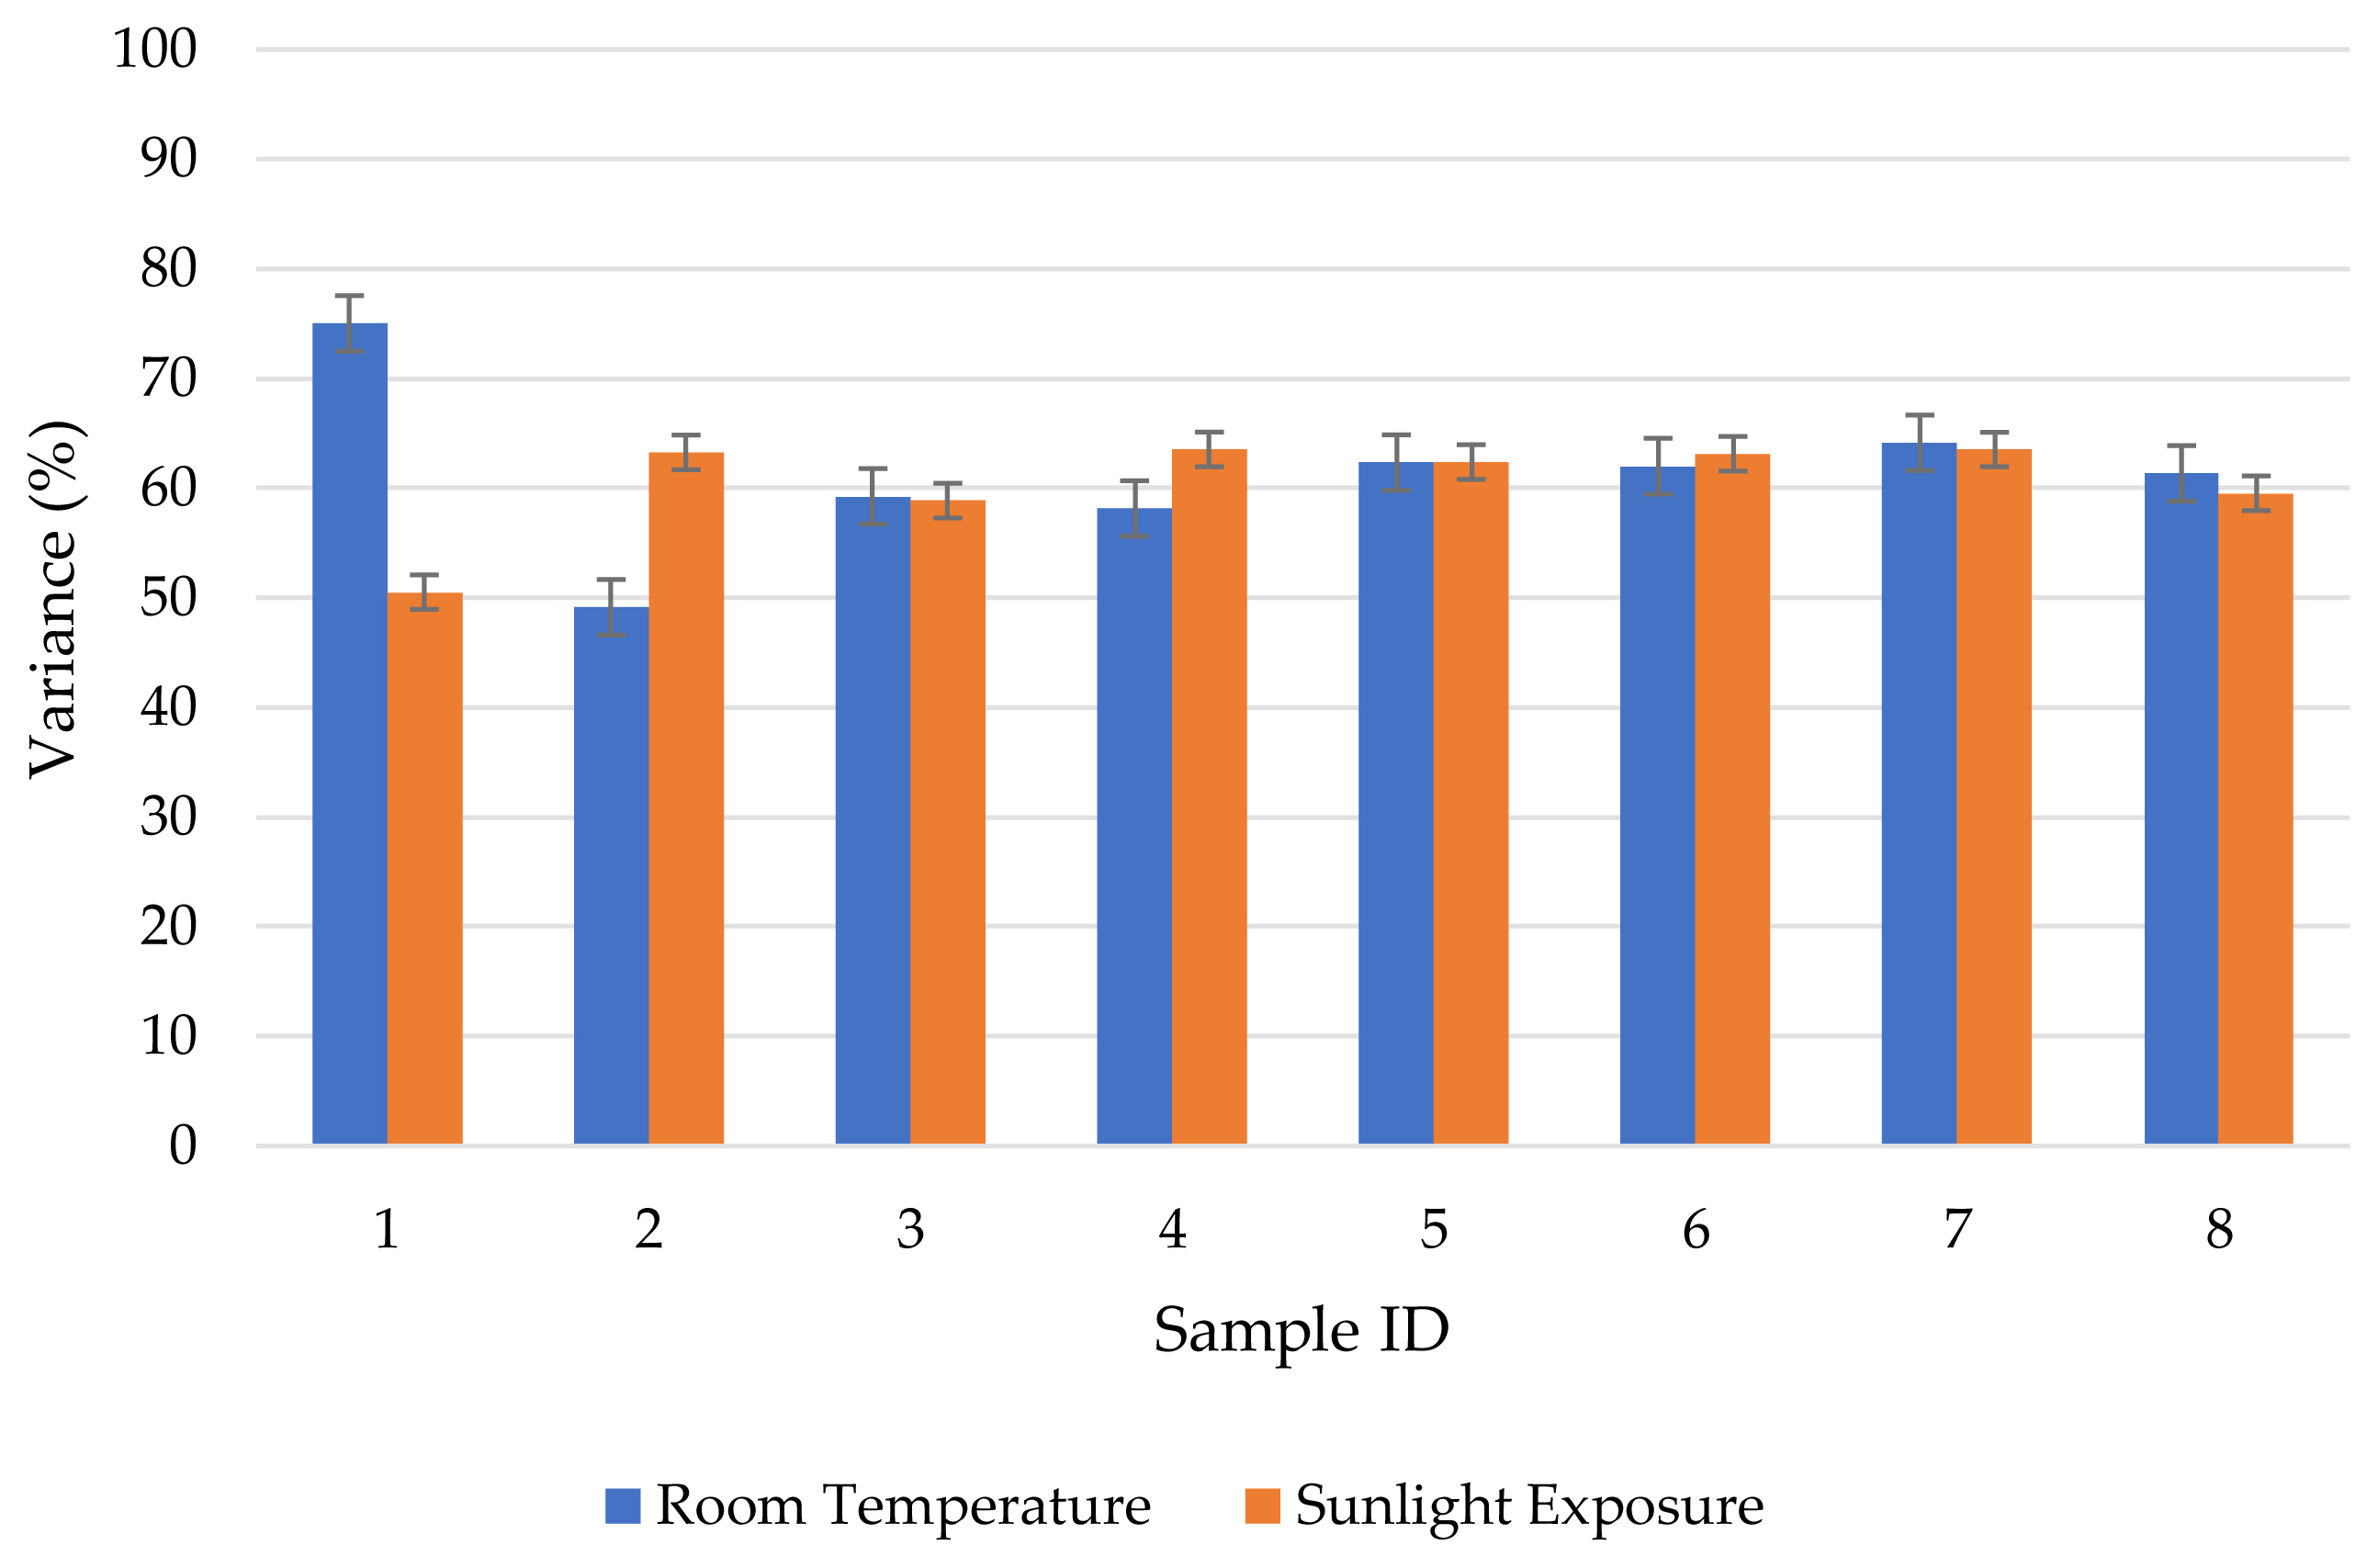
Cumulative variability

The cumulative variance (%) calculated from factor analysis as presented in Table 5 was used to compare the degree of variation from different exposure matrices and storage condition. They were categorized: little variation, 10% < moderate variance 10% 50% and high variance, >50 respectively. The cumulative variability of different factors (storage time, antimony, pH, TSSC acidity and specific gravity) over samples are shown in Figure 6. The storage condition of sample assessed in decreasing order for room temperature is sample CC > MO > FO > MP > TL > SO > PC > LA, while sunlight exposure is PC > MO > FO > LA > MP > TL > SO > CC. We can therefore deduce that Sample 1 decrease steadily due to high interaction from storage conditions while Sample 2 showed moderate interaction and other sampled beverages were moderate with slight increase from storage condition [27].

Conclusions

The study showed that antimony leaching occurs in plastic bottles in respective of storage condition, thus contaminating carbonated beverages and its ingredients. This supports preceding research findings that not all PET bottles are of same quality. Quality assessment conducted on eight carbonated beverage showed that antimony leaches more when exposed to sunlight for long period compared to room temperature, which influences acidity, pH, TSSC and specific gravity respectively. Chemometric assessment reveals that contamination factor (CF) and Pollution Load Index PLI of antimony leached has no serious issues for both storage conditions. Pearson correlation analysis conducted using rotated varimax confirms that antimony was positive correlated to other parameters except pH for all samples. The Tolerable Dose Index (TDI) and Hazard Index (HI) conducted on antimony show no health risk on consumed carbonated beverage (TDI < 1; HI < 1) over 15 weeks of production. Relevant stakeholders are reminded of their obligation to guide the populace by mandating food and drink manufacturers to imprint caution advice on plastic materials most especially beverage or soft drinks to state “store in a cool environment” or “keep off from sunlight”. For Herbal therapists, new bottles should be used as most are fond of using old recycled bottles, which is detrimental to human health and wellbeing.

Conflict of interest

The author declares no conflict of interest regarding the publication of this manuscript

Notes

CRediT author statement
DOO: Conceptualization, Investigation, Methodology, Formal analysis, Software, Writing-Original Draft Preparation, Writing-Reviewing &Editing

References

1. Taiwo AM, Aigbodion CO, Ojekunle OZ, Akinhanmi TF. Health risk assessment of metals in selected drinks from Abeokuta, Southwestern Nigeria. Biological trace element research 2020;197(2):694-707 https://doi.org/10.1007/s12011-020-02029-7 .
crossref pmid
2. Centers for Disease Control and Prevention (CDC). Fourth national report on human exposure to environmental chemicals, updated tables January 2019; Centers for Disease Control and Prevention, U.S. Department of Health and Human Services; 2019. Assessed on February 2, 2021. https://www.cdc.gov/exposurereport/ .

3. Carneado S, Hernández-Nataren E, López-Sánchez JF, Sahuquillo A. Migration of antimony from polyethylene terephthalate used in mineral water bottles. Food Chemistry 2015;166: 544-550 http://doi.org/10.1016/j.foodchem.2014.06.041 .
crossref pmid
4. Grund SC, Hanusch K, Breunig HJ, Wolf HU. Antimony and antimony compounds. Ullmann’s Encyclopedia of Industrial Chemistry; 2000. http://doi.org/10.1002/14356007.a03_055.pub2 .
crossref
5. Cooper RG, Harrison AP. The exposure to and health effects of antimony. Indian journal of occupational and environmental medicine 2009;13(1):3 https://doi.org/10.4103/0019-5278.50716 .
crossref pmid pmc
6. Dasgupta B, Khurana S. Waste management of PET bottles. J Environ Res Dev 2008;2(4):862-867.

7. Ibukun Y. Nigeria enlists big beverage companies to fight plastic waste. Bloomberg Businessweek; 2019. Assessed on February 10, 2021. https://www.bloomberg.com/news/articles/2019-11-13/nigeria-enlists-big-beverage-companies-to-fight-plastic-waste .

8. Akande EA, Adeyanju JA, Oladipo OA, Oyetunji FF. Effects of different packaging materials on the shelf stability of ginger juice. Greener J Sci Eng Technol 2014;4(2):038-044.
crossref
9. Fan YY, Zheng JL, Ren JH, Luo J, Cui XY, Ma LQ. Effects of storage temperature and duration on release of antimony and bisphenol a from polyethylene terephthalate drinking water bottles of China. Environmental Pollution 2014;192: 113-120 http://doi.org/10.1016/j.envpol.2014.05.012 .
crossref pmid
10. Bach C, Dauchy X, Severin I, Munoz JF, Etienne S, Chagnon MC. Effect of temperature on the release of intentionally and non-intentionally added substances from polyethylene terephthalate (PET) bottles into water: chemical analysis and potential toxicity. Food Chemistry 2013;139(1–4):672-680 http://doi.org/10.1016/j.foodchem.2013.01.046 .
crossref pmid
11. Bach C, Dauchy X, Severin I, Munoz JF, Etienne S, Chagnon MC. Effect of sunlight exposure on the release of intentionally and/or non-intentionally added substances from polyethylene terephthalate (PET) bottles into water: chemical analysis and in vitro toxicity. Food chemistry 2014;162: 63-71.
crossref pmid
12. Chia SL, Rosnah S, Noranizan MA, Wan Ramli WD. The effect of storage on the quality attributes of ultraviolet-irradiated and thermally pasteurised pineapple juices. Int Food Res J 2012;19(3):1001-1010.

13. Hansen C, Tsirigotaki A, Bak SA, Pergantis SA, Stürup S, Gammelgaard B, et al. Elevated antimony concentrations in commercial juices. Journal of Environmental Monitoring 2010;12(4):822-824 http://doi.org/10.1039/b926551a .
crossref pmid
14. Hureiki L, Mouneimne Y. Antimony release in PET bottled natural water in Lebanon. Water Science and Technology: Water Supply 2012;12(2):193-199 https://doi.org/10.2166/ws.2012.128 .
crossref
15. Serpen JY. Comparison of sugar content in bottled 100% fruit juice versus extracted juice of fresh fruit. Food Nutri Sci 2012;3: 1509-1513 https://doi.org/10.4236/fns.2012.311196 .
crossref
16. Cheng X, Shi H, Adams CD, Ma Y. Assessment of metal contaminations leaching out from recycling plastic bottles upon treatments. Environmental Science and Pollution Research 2010;17(7):1323-1330 https://doi.org/10.1007/s11356-010-0312-4 .
crossref pmid
17. Belzile N, Chen YW, Filella M. Human exposure to antimony: I. Sources and intake. Critical reviews in environmental science and technology 2011;41(14):1309-1373 https://doi.org/10.1080/10643381003608227 .
crossref
18. Westerhoff P, Prapaipong P, Shock E, Hillaireau A. Antimony leaching from polyethylene terephthalate (PET) plastic used for bottled drinking water. Water Research 2008;42(3):551-556 http://doi.org/10.1016/j.watres.2007.07.048 .
crossref pmid
19. Chapa-Martínez CA, Hinojosa-Reyes L, Hernández-Ramírez A, Ruiz-Ruiz E, Maya-Treviño L, Guzmán-Mar JL. An evaluation of the migration of antimony from polyethylene terephthalate (PET) plastic used for bottled drinking water. Science of the total Environment 2016;565: 511-518 http://doi.org/10.1016/j.scitotenv.2016.04.184 .
crossref pmid
20. Reimann C, Birke M, Filzmoser P. Bottled drinking water: water contamination from bottle materials (glass, hard PET, soft PET), the influence of colour and acidification. Applied Geochemistry 2010;25(7):1030-1046 https://doi.org/10.1016/j.apgeochem.2010.04.009 .
crossref
21. Adepoju-Bello AA, Oguntibeju OO, Onuegbu MT, Ayoola GAA, Coker HAB. Analysis of selected metallic impurities in soft drinks marketed in Lagos, Nigeria. African Journal of Biotechnology 2012;11(20):4676-4680.

22. Magomya AM, Yebpella GG, Okpaegbe UC. An Assessment of metal contaminant levels in selected soft drinks sold in Nigeria. Int J Innov Sci Eng Technol 2015;2(10):517-522.

23. National Agency for Food & Drug Administration & Control (NAFDAC). Good manufacturing practice guidelines for pharmaceutical products; 2016. Assessed on February 2, 2021. https://www.nafdac.gov.ng/wp-content/uploads/Files/Resources/Guidelines/DRUG_GUIDELINES/NAFDAC-GMP-GUIDELINES-FOR-PHARMACEUTICAL-PRODUCTS-2016.pdf .

24. National Agency for Food & Drug Administration & Control (NAFDAC). Guidelines for inspection & requirements for packaged water facility. Nigeria (fresh and renewal applications). Food Safety & Applied Nutrition (FSAN) Directorate. Doc. Ref. No: FSAN-GDL-002-01 2018;1-11. Assessed on February 2, 2021. https://www.nafdac.gov.ng/wp-content/uploads/Files/Resources/Guidelines/FOOD_GUIDELINES/Guidelines-for-Inspection-and-Requirements-for-Packaged-Water-Facility-in-Nigeria.pdf .

25. Baird RB, Rice CEW, Eaton AD. Standard methods for the examination of water and wastewater. 23rd Ed. Water environment federation, American Public Health Association. American Water Works Association; 2017.

26. Ball DW. Concentration scales for sugar solutions. J Chem Educ 2006;83(10):1489 https://doi.org/10.1021/ed083p1489 .
crossref
27. Enyoh CE, Verla AW, Egejuru NJ. pH variations and chemometric assessment of borehole water in Orji, Owerri Imo State, Nigeria. J Environ Anal Chem 2018;5(2):1-9 http://doi:10.4172/2380-2391.1000238 .

28. World Health Organization (WHO). Guidelines for drinking-water quality. 2017. Fourth edition incorporating the first addendum; Geneva, Switzerland: World Health Organization; Assessed on February 2, 2021. http://apps.who.int/iris/bitstream/10665/254637/1/789241549950-eng.pdf?ua=1 .

29. Agency for Toxic Substances and Disease Registry (ATSDR). Toxicological Profile for Antimony and compounds, Antimony, ATSDR, CAS 7440-36-0, 2019. National center for environmental health and agency for toxic substances and disease registry; Centers for disease control and prevention; USA: Assessed on February 2, 2021. https://www.atsdr.cdc.gov/toxprofiles/tp23.pdf .

30. Lorenc W, Markiewicz B, Kruszka D, Kachlicki P, Barałkiewicz D. Total versus inorganic and organic species of As, Cr, and Sb in flavored and functional drinking waters: Analysis and risk assessment. Molecules 2020;25(5):1099 https://doi.org/10.3390/molecules25051099 .
crossref pmid pmc
31. United States Environmental Protection Agency (US-EPA). Regional screening levels (RSLs)-User’s Guide; 2017. Assessed on February 5, 2021. http://www.epa.gov/risk/regional-screening-levels-rsls-users-guide .

32. United States Environmental Protection Agency (US-EPA). About Acute exposure guideline levels (AEGLs); U.S. environmental protection agency; 2018b. Assessed on January 26, 2021. https://www.epa.gov/aegl/about-acute-exposure-guideline-levels-aegls .

33. United States Environmental Protection Agency (US-EPA). Provisional peer reviewed toxicity values for antimony trioxide (CASRN 1309-64-4) Superfund health risk technical support center; National Center for Environmental Assessment Office of Research and Development U.S. Environmental Protection Agency; Cincinnati, OH 45268: EPA/690/R-08/004F Final 2008. Assessed on January 22, 2020. https://cfpub.epa.gov/ncea/pprtv/documents/AntimonyTrioxide.pdf .

34. United States Environmental Protection Agency (US-EPA). 2018 Edition of the drinking water standards and health advisories; Washington, DC: Office of Water, U.S. Environmental Protection Agency; EPA822S1 2001-2018a. Assessed on February 2, 2021. https://www.epa.gov/system/files/documents/2022-01/dwtable2018.pdf .

35. IRIS. Antimony (CASRN 7440-36-0). Integrated Risk Information System. 2015a; Database quest; last revised: Oral RfD 02/01/1991. US-EPA; Assessed on February 13, 2021. http://www.epa.gov/iris/subst/0006.htm .

36. IRIS. Antimony trioxide (CASRN 1309-64-4). Integrated Risk Information System 2015b; Database quest; US-EPA; Assessed on February 2, 2021. http://www.epa.gov/iris/subst/0676.htm .

37. Ali M, Ayamba AMA, Dinku DE, Carboo D, Awuku FJ, Dorleku M. Migration of inorganic antimony into polyethylene terephthalate bottled water marketed in the greater accra region of Ghana. Migration 2017;7(24):18-29.

38. Nawrocki J, Dąbrowska A, Borcz A. Investigation of carbonyl compounds in bottled waters from Poland. Water Research 2002;36(19):4893-4901 https://doi.org/10.1016/S0043-1354(02)00201-4 .
crossref pmid
39. Sánchez-Moreno C, Plaza L, de Ancos B, Cano MP. Nutritional characterisation of commercial traditional pasteurised tomato juices: carotenoids, vitamin C and radical-scavenging capacity. Food Chemistry 2006;98(4):749-756 https://doi.org/10.1016/j.foodchem.2005.07.015 .
crossref
40. Yadav R, Tripathi AD, Jha A. Effect of storage time on Aloe vera beverage. International Journal of food, nutrition and public health 2013;6(2):173-192.

41. lamaran M, Amutha S. Effect of total soluble solids and CO2 pressure on physicochemical and sensory qualities of carbonated banana and sapota beverages. J Food Sci Technol 2007;44(2):178-182.

42. Barwal VS, Singh TK, Alkesh M. Studies on processing and development of ready to serve drink from bittergourd. J Food Sci Technol 2005;42(3):217-220.

43. Sirohi D, Patel S, Choudhary PL, Sahu C. Studies on preparation and storage of whey-based mango herbal pudina (Menthaarvensis) beverage. J Food Sci Technol 2005;42(1):157-161.

44. United States Environmental Protection Agency (US-EPA). Basic information about antimony in drinking water; Assessed on February 2, 2021. http://water.epa.gov/drink/contaminants/basicinformation/antimony.cfm .

45. Al-Otoum F, Al-Ghouti MA, Costa OS, Khraisheh M. Impact of temperature and storage time on the migration of antimony from polyethylene terephthalate (PET) containers into bottled water in Qatar. Environmental monitoring and assessment 2017;189(12):1-12 https://doi.org/10.1007/s10661-017-6342-3 .
crossref pmid
46. Omokpariola JO, Omokpariola DO, Chioma E, Omokpariola O. 2011;Risk assessment of polycyclic aromatic hydrocarbons and total petroleum hydrocarbons in oilfield produced water and sea water at Gulf of Guinea Oilfield, Nigeria. Advanced Journal of chemistry–section B 2011;3(1):68-85 http://dx.doi.org/10.22034/ajcb.2021.121909 .

47. International Agency for Research on Cancer (IARC). Agents classified by the IARC monographs; 2015. 1-114. Lyon France: Assessed on February 8, 2021. https://monographs.iarc.fr/ENG/Classification/List_of_Classifications_Vol1-114.pdf .

48. National Toxicology Program (NTP). Report on carcinogens monograph on antimony trioxide; 2018. Research Triangle Park NC: Assessed on February 8, 2021. https://ntp.niehs.nih.gov/publications/roc/rocmgraph13/index.html?utm_source=direct&utm_medium=prod&utm_campaign=ntpgolinks&utm_term=rocmgraph13abs .

49. Molaee Aghaee E, Alimohammadi M, Nabizadeh R, Naseri S, Mahvi AH, Yaghmaeian K, et al. Effects of storage time and temperature on the antimony and some trace element release from polyethylene terephthalate (PET) into the bottled drinking water. Journal of Environmental Health Science and Engineering 2014;12(1):1-7 https://doi.org/10.1186/s40201-014-0133-3 .
crossref pmid pmc
50. European Union Risk Assessment Report (EU-RAR). Diantimony trioxide Risk assessment 2008.

51. Bredsdorff L, Nielsen E. Antimony: Evaluation of health hazards and proposal of a health based quality criterion for soil. Environmental Project No 1727 2015.

52. Omokpariola DO, Nduka JK, Omokpariola PL, Omokpariola ECO. Ionic composition of rainwater from different sampling surfaces across selected locations in Rivers State, Nigeria. World Scientific News 2020;150: 132-147.

53. Chaisupakitsin M, Chairat-utai P, Jarusiripot C. Degradation of polyethylene terephthalate bottles after long sunlight exposure. Songklanakarin Journal of Science & Technology 2019;41(2):259-264.

54. KILIÇ S, KILIÇ M. Method Validation for the determination of toxic elements in fizzy fruity mineral water drinks using ICP-MS. Eurasian Journal of Biological and Chemical Sciences 2019;2(2):38-41.

Figure 1
Effect of antimony leaching on storage time and condition: sample 1–8: Coca-Cola, Lacasera apple, Swan orange, Pepsi cola, Fanta orange, Mirinda pineapple, Mirinda orange, Teem lemon.
eaht-37-3-e2022019f1.jpg
Figure 2
Effect of pH on storage time and condition: sample 1–8: Coca-Cola, Lacasera apple, Swan orange, Pepsi cola, Fanta orange, Mirinda pineapple, Mirinda orange, Teem lemon.
eaht-37-3-e2022019f2.jpg
Figure 3
Effect of TSSC on storage time and condition: sample 1–8: Coca-Cola, Lacasera apple, Swan orange, Pepsi cola, Fanta orange, Mirinda pineapple, Mirinda orange, Teem lemon.
eaht-37-3-e2022019f3.jpg
Figure 4
Effect of acidity on storage time and condition: Sample 1–8: Coca-Cola, Lacasera apple, Swan orange, Pepsi cola, Fanta orange, Mirinda pineapple, Mirinda orange, Teem lemon.
eaht-37-3-e2022019f4.jpg
Figure 5
Effect of specific gravity on storage time and condition: Sample 1–8: Coca-Cola, Lacasera apple, Swan orange, Pepsi cola, Fanta orange, Mirinda pineapple, Mirinda orange, Teem lemon.
eaht-37-3-e2022019f5.jpg
Figure 6
Cumulative variance of different storage condition: Sample 1–8: Coca-Cola, Lacasera apple, Swan orange, Pepsi cola, Fanta orange, Mirinda pineapple, Mirinda orange, Teem lemon.
eaht-37-3-e2022019f6.jpg
Table 1
Sampled carbonated beverages.
Sample ID Brand name Batch number Manufacturing date (D/M/Y) Expiry date (D/M/Y) Number of drinks
1 (CC) Coca-Cola AR4 (19:51) 18/07/2020 18/12/2020 12
2 (LA) Lacasera apple 5220411630O4 12/06/2020 11/12/2020 12
3 (SO) Swan orange 1047090511 23/05/2020 19/11/2020 12
4 (PC) Pepsi cola IK46 (B10:43) 27/05/2020 25/11/2020 12
5 (FO) Fanta orange AR4 (09:03) 08/07/2020 08/12/2020 12
6 (MP) Mirinda pineapple AB06X (B00:09) 10/06/2020 10/12/2020 12
7 (MO) Mirinda orange AB613 (B21:37) 12/05/2020 12/11/2020 12
8 (TL) Teem lemon AB27X (B00:11) 25/06/2020 25/12/2020 12
Table 2
Estimated daily intake (EDI) and chronic daily intake (CDI) of antimony leaching from storage time and condition.
Sample ID Exposure Adults-EDI (mg/kg/day) Children-EDI (mg/kg/day) Adults-CDI (mg/kg/day) Children-CDI (mg/kg/day)

(Days) Room temp. Sunlight Room temp. Sunlight Room temp. Sunlight Room temp. Sunlight
1 0 1.71E-05 1.71E-05 1.60E-04 1.60E-04 1.64E-11 1.64E-11 1.32E-11 1.32E-11
3 2.57E-05 5.14E-05 2.40E-04 4.80E-04 2.47E-11 4.93E-11 1.97E-11 3.95E-11
6 2.57E-05 6.00E-05 2.40E-04 5.60E-04 2.47E-11 5.75E-11 1.97E-11 4.60E-11
9 5.14E-05 7.71E-05 4.80E-04 7.20E-04 4.93E-11 7.40E-11 3.95E-11 5.92E-11
12 7.71E-05 8.57E-05 7.20E-04 8.00E-04 7.40E-11 8.22E-11 5.92E-11 6.58E-11
15 9.43E-05 0.000129 8.80E-04 1.20E-03 9.04E-11 1.23E-10 7.23E-11 9.86E-11
2 0 8.57E-06 8.57E-06 8.00E-05 8.00E-05 8.22E-12 8.22E-12 6.58E-12 6.58E-12
3 8.57E-06 1.71E-05 8.00E-05 1.60E-04 8.22E-12 1.64E-11 6.58E-12 1.32E-11
6 8.57E-06 4.29E-05 8.00E-05 4.00E-04 8.22E-12 4.11E-11 6.58E-12 3.29E-11
9 1.71E-05 4.29E-05 1.60E-04 4.00E-04 1.64E-11 4.11E-11 1.32E-11 3.29E-11
12 2.57E-05 6.00E-05 2.40E-04 5.60E-04 2.47E-11 5.75E-11 1.97E-11 4.60E-11
15 2.57E-05 6.00E-05 2.40E-04 5.60E-04 2.47E-11 5.75E-11 1.97E-11 4.60E-11
3 0 3.43E-05 3.43E-05 3.20E-04 3.20E-04 3.29E-11 3.29E-11 2.63E-11 2.63E-11
3 5.14E-05 6.00E-05 4.80E-04 5.60E-04 4.93E-11 5.75E-11 3.95E-11 4.60E-11
6 5.14E-05 7.71E-05 4.80E-04 7.20E-04 4.93E-11 7.40E-11 3.95E-11 5.92E-11
9 5.14E-05 7.71E-05 4.80E-04 7.20E-04 4.93E-11 7.40E-11 3.95E-11 5.92E-11
12 6.86E-05 8.57E-05 6.40E-04 8.00E-04 6.58E-11 8.22E-11 5.26E-11 6.58E-11
15 8.57E-05 9.43E-05 8.00E-04 8.00E-05 8.22E-11 9.04E-11 6.58E-11 7.23E-11
4 0 8.57E-06 8.57E-06 8.00E-05 8.00E-05 8.22E-12 8.22E-12 6.58E-12 6.58E-12
3 2.57E-05 2.57E-05 2.40E-04 2.40E-04 2.47E-11 2.47E-11 1.97E-11 1.97E-11
6 2.57E-05 2.57E-05 2.40E-04 2.40E-04 2.47E-11 2.47E-11 1.97E-11 1.97E-11
9 5.14E-05 6.00E-05 4.80E-04 5.60E-04 4.93E-11 5.75E-11 3.95E-11 4.60E-11
12 5.14E-05 6.86E-05 4.80E-04 6.40E-04 4.93E-11 6.58E-11 3.95E-11 5.26E-11
15 5.14E-05 8.57E-05 4.80E-04 8.00E-04 4.93E-11 8.22E-11 3.95E-11 6.58E-11
5 0 8.57E-06 8.57E-06 8.00E-05 8.00E-05 8.22E-12 8.22E-12 6.58E-12 6.58E-12
3 1.71E-05 1.71E-05 1.60E-04 1.60E-04 1.64E-11 1.64E-11 1.32E-11 1.32E-11
6 1.71E-05 4.29E-05 1.60E-04 4.00E-04 1.64E-11 4.11E-11 1.32E-11 3.29E-11
9 4.29E-05 4.29E-05 4.00E-04 4.00E-04 4.11E-11 4.11E-11 3.29E-11 3.29E-11
12 4.29E-05 7.71E-05 4.00E-04 7.20E-04 4.11E-11 7.4E-11 3.29E-11 5.92E-11
15 6.86E-05 1.20E-04 6.40E-04 1.12E-03 6.58E-11 1.15E-10 5.26E-11 9.21E-11
6 0 1.71E-05 1.71E-05 1.60E-04 1.60E-04 1.64E-11 1.64E-11 1.32E-11 1.32E-11
3 1.71E-05 2.57E-05 1.60E-04 2.40E-04 1.64E-11 2.47E-11 1.32E-11 1.97E-11
6 1.71E-05 2.57E-05 1.60E-04 2.40E-04 1.64E-11 2.47E-11 1.32E-11 1.97E-11
9 3.43E-05 4.29E-05 3.20E-04 4.00E-04 3.29E-11 4.11E-11 2.63E-11 3.29E-11
12 6.00E-05 6.86E-05 5.60E-04 6.40E-04 5.75E-11 6.58E-11 4.6E-11 5.26E-11
15 6.00E-05 8.57E-05 5.60E-04 8.00E-04 5.75E-11 8.22E-11 4.6E-11 6.58E-11
7 0 2.57E-05 2.57E-05 2.40E-04 2.40E-04 2.47E-11 2.47E-11 1.97E-11 1.97E-11
3 2.57E-05 4.29E-05 2.40E-04 4.00E-04 2.47E-11 4.11E-11 1.97E-11 3.29E-11
6 2.57E-05 6.86E-05 2.40E-04 6.40E-04 2.47E-11 6.58E-11 1.97E-11 5.26E-11
9 4.29E-05 8.57E-05 4.00E-04 8.00E-04 4.11E-11 8.22E-11 3.29E-11 6.58E-11
12 4.29E-05 9.43E-05 4.00E-04 8.80E-04 4.11E-11 9.04E-11 3.29E-11 7.23E-11
15 5.14E-05 9.43E-05 4.80E-04 8.80E-04 4.93E-11 9.04E-11 3.95E-11 7.23E-11
8 0 8.57E-06 8.57E-06 8.00E-05 8.00E-05 8.22E-12 8.22E-12 6.58E-12 6.58E-12
3 2.57E-05 1.71E-05 2.40E-04 1.60E-04 2.47E-11 1.64E-11 1.97E-11 1.32E-11
6 2.57E-05 5.14E-05 2.40E-04 4.80E-04 2.47E-11 4.93E-11 1.97E-11 3.95E-11
9 2.57E-05 5.14E-05 2.40E-04 4.80E-04 2.47E-11 4.93E-11 1.97E-11 3.95E-11
12 4.29E-05 5.14E-05 4.00E-04 4.80E-04 4.11E-11 4.93E-11 3.29E-11 3.95E-11
15 5.14E-05 8.57E-05 4.80E-04 8.00E-04 4.93E-11 8.22E-11 3.95E-11 6.58E-11

Sample 1–8: Coca-Cola, Lacasera apple, Swan orange, Pepsi cola, Fanta orange, Mirinda pineapple, Mirinda orange, Teem lemon.

Table 3
Tolerance dose index (TDI) and hazard index (HI) of antimony leaching from storage time and condition.
Sample ID Exposure Adults-TDI (from EDI) Children-TDI (from EDI) Adults-HI (from CDI) Children-HI (from CDI)

(Days) Room temp. Sunlight Room temp. Sunlight Room temp. Sunlight Room temp. Sunlight
1 0 2.86E-03 2.86E-03 2.70E-02 2.70E-02 2.86E-03 2.86E-03 2.70E-02 2.70E-02
3 4.29E-03 8.57E-03 4.00E-02 8.00E-02 4.29E-03 8.57E-03 4.00E-02 8.00E-02
6 4.29E-03 1.00E-02 4.00E-02 9.30E-02 4.29E-03 1.00E-02 4.00E-02 9.30E-02
9 8.57E-03 1.29E-02 8.00E-02 1.20E-01 8.57E-03 1.29E-02 8.00E-02 1.20E-01
12 1.29E-02 1.43E-02 1.20E-01 1.33E-01 1.29E-02 1.43E-02 1.20E-01 1.33E-01
15 1.57E-02 2.14E-02 1.47E-01 2.00E-01 1.57E-02 2.14E-02 1.47E-01 2.00E-01
2 0 1.43E-03 1.43E-03 1.30E-02 1.30E-02 1.43E-03 1.43E-03 1.30E-02 1.30E-02
3 1.43E-03 2.86E-03 1.30E-02 2.70E-02 1.43E-03 2.86E-03 1.30E-02 2.70E-02
6 1.43E-03 7.14E-03 1.30E-02 6.70E-02 1.43E-03 7.14E-03 1.30E-02 6.70E-02
9 2.86E-03 7.14E-03 2.70E-02 6.70E-02 2.86E-03 7.14E-03 2.70E-02 6.70E-02
12 4.29E-03 1.00E-02 4.00E-02 9.30E-02 4.29E-03 1.00E-02 4.00E-02 9.30E-02
15 4.29E-03 1.00E-02 4.00E-02 9.30E-02 4.29E-03 1.00E-02 4.00E-02 9.30E-02
3 0 5.71E-03 5.71E-03 5.30E-02 5.30E-02 5.71E-03 5.71E-03 5.30E-02 5.30E-02
3 8.57E-03 1.00E-02 8.00E-02 9.30E-02 8.57E-03 1.00E-02 8.00E-02 9.30E-02
6 8.57E-03 1.29E-02 8.00E-02 1.20E-01 8.57E-03 1.29E-02 8.00E-02 1.20E-01
9 8.57E-03 1.29E-02 8.00E-02 1.20E-01 8.57E-03 1.29E-02 8.00E-02 1.20E-01
12 1.14E-02 1.43E-02 1.07E-02 1.33E-01 1.14E-02 1.43E-02 1.07E-02 1.33E-01
15 1.43E-02 1.57E-02 1.33E-01 1.47E-01 1.43E-02 1.57E-02 1.33E-01 1.47E-01
4 0 1.43E-03 1.43E-03 1.30E-02 1.30E-02 1.43E-03 1.43E-03 1.30E-02 1.30E-02
3 4.29E-03 4.29E-03 4.00E-02 4.00E-02 4.29E-03 4.29E-03 4.00E-02 4.00E-02
6 4.29E-03 4.29E-03 4.00E-02 4.00E-02 4.29E-03 4.29E-03 4.00E-02 4.00E-02
9 8.57E-03 1.00E-02 8.00E-02 9.30E-02 8.57E-03 1.00E-02 8.00E-02 9.30E-02
12 8.57E-03 1.14E-01 8.00E-02 1.07E-01 8.57E-03 1.14E-01 8.00E-02 1.07E-01
15 8.57E-03 1.43E-01 8.00E-02 1.33E-01 8.57E-03 1.43E-01 8.00E-02 1.33E-01
5 0 1.43E-03 1.43E-03 1.30E-02 1.30E-02 1.43E-03 1.43E-03 1.30E-02 1.30E-02
3 2.86E-03 2.86E-03 2.70E-02 2.70E-02 2.86E-03 2.86E-03 2.70E-02 2.70E-02
6 2.86E-03 7.14E-03 2.70E-02 6.70E-02 2.86E-03 7.14E-03 2.70E-02 6.70E-02
9 7.14E-03 7.14E-03 6.70E-02 6.70E-02 7.14E-03 7.14E-03 6.70E-02 6.70E-02
12 7.14E-03 1.29E-02 6.70E-02 1.20E-01 7.14E-03 1.29E-02 6.70E-02 1.20E-01
15 1.14E-03 2.00E-02 1.07E-01 1.87E-01 1.14E-03 2.00E-02 1.07E-01 1.87E-01
6 0 2.86E-03 2.86E-03 2.70E-02 2.70E-02 2.86E-03 2.86E-03 2.70E-02 2.70E-02
3 2.86E-03 4.29E-03 2.70E-02 4.00E-02 2.86E-03 4.29E-03 2.70E-02 4.00E-02
6 2.86E-03 4.29E-03 2.70E-02 4.00E-02 2.86E-03 4.29E-03 2.70E-02 4.00E-02
9 5.71E-03 7.14E-03 5.30E-02 6.70E-02 5.71E-03 7.14E-03 5.30E-02 6.70E-02
12 1.00E-02 1.14E-02 9.30E-02 1.07E-01 1.00E-02 1.14E-02 9.30E-02 1.07E-01
15 1.00E-02 1.43E-02 9.30E-02 1.33E-01 1.00E-02 1.43E-02 9.30E-02 1.33E-01
7 0 4.29E-03 4.29E-03 4.00E-02 4.00E-02 4.29E-03 4.29E-03 4.00E-02 4.00E-02
3 4.29E-03 7.14E-03 4.00E-02 6.70E-02 4.29E-03 7.14E-03 4.00E-02 6.70E-02
6 4.29E-03 1.14E-02 4.00E-02 1.07E-01 4.29E-03 1.14E-02 4.00E-02 1.07E-01
9 7.14E-03 1.43E-02 6.70E-02 1.33E-01 7.14E-03 1.43E-02 6.70E-02 1.33E-01
12 7.14E-03 1.57E-02 6.70E-02 1.47E-01 7.14E-03 1.57E-02 6.70E-02 1.47E-01
15 8.57E-03 1.57E-02 8.00E-02 1.47E-01 8.57E-03 1.57E-02 8.00E-02 1.47E-01
8 0 1.43E-03 1.43E-03 1.30E-02 1.30E-02 1.43E-03 1.43E-03 1.30E-02 1.30E-02
3 4.29E-03 2.86E-03 4.00E-02 2.70E-02 4.29E-03 2.86E-03 4.00E-02 2.70E-02
6 4.29E-03 8.57E-03 4.00E-02 8.00E-02 4.29E-03 8.57E-03 4.00E-02 8.00E-02
9 4.29E-03 8.57E-03 4.00E-02 8.00E-02 4.29E-03 8.57E-03 4.00E-02 8.00E-02
12 7.14E-03 8.57E-03 6.70E-02 8.00E-02 7.14E-03 8.57E-03 6.70E-02 8.00E-02
15 8.57E-03 1.43E-02 8.00E-02 1.33E-02 8.57E-03 1.43E-02 8.00E-02 1.33E-02

Sample 1–8: Coca-Cola, Lacasera apple, Swan orange, Pepsi cola, Fanta orange, Mirinda pineapple, Mirinda orange, Teem lemon.

Table 4
Contamination factor (CF) and pollution load index of antimony at different storage time.
1 (CC) 2 (LA) 3 (SO) 4 (PC) 5 (FO) 6 (MP) 7 (MO) 8 (TL)

R. P. S. E. R. P. S. E. R. P. S. E. R. P. S. E. R. P. S. E. R. P. S. E. R. P. S. E. R. P. S. E.
CF0 0.10 0.10 0.05 0.05 0.20 0.20 0.05 0.05 0.05 0.05 0.10 0.10 0.15 0.15 0.05 0.05
CF3 0.15 0.30 0.05 0.10 0.30 0.35 0.15 0.15 0.10 0.10 0.10 0.15 0.15 0.25 0.15 0.10
CF6 0.15 0.35 0.05 0.25 0.30 0.45 0.15 0.15 0.10 0.25 0.10 0.15 0.15 0.40 0.15 0.30
CF9 0.30 0.45 0.10 0.25 0.30 0.45 0.30 0.35 0.25 0.25 0.20 0.25 0.25 0.50 0.15 0.30
CF12 0.45 0.50 0.15 0.35 0.40 0.50 0.30 0.40 0.25 0.45 0.35 0.40 0.25 0.55 0.25 0.30
CF15 0.55 0.75 0.15 0.35 0.50 0.55 0.30 0.50 0.40 0.70 0.35 0.50 0.30 0.55 0.30 0.50
ΣCF 1.70 2.45 0.55 1.35 2.00 2.5 1.25 1.60 1.15 1.80 1.20 1.55 1.25 2.40 1.05 1.55
Mean CF 0.28 0.41 0.09 0.23 0.33 0.42 0.21 0.27 0.19 0.30 0.20 0.26 0.21 0.40 0.18 0.26
PLI 0.23 0.36 0.08 0.18 0.32 0.40 0.18 0.21 0.15 0.21 0.17 0.22 0.20 0.36 0.15 0.20
Table 5
Principal component analysis (rotated varimax) across different storage condition.
Sample ID 1 (CC) 2 (LA) 3 (SO) 4 (PC) 5 (FO) 6 (MP) 7 (MO) 8 (TL)

R.P. S.E. R.P. S.E. R.P. S.E. R.P. S.E. R.P. S.E. R.P. S.E. R.P. S.E. R.P. S.E.
Factor 1 Factor 2 Factor 1 Factor 1 Factor1 Factor 1 Factor 1 Factor 1 Factor 1 Factor 1 Factor 1 Factor 1 Factor 1 Factor1 Factor 1 Factor 1 Factor1

Storage time (days) 0.983 −0.152 0.969 0.975 0.986 0.984 0.987 0.984 0.994 0.993 0.995 0.982 0.988 0.990 0.993 0.982 0.994
Antimony (Sb) mg/L 0.963 −0.099 0.970 0.975 0.986 0.965 0.976 0.962 0.967 0.956 0.958 0.940 0.945 0.949 0.977 0.969 0.947
pH −0.812 0.306 −0.818 −0.768 −0.978 −0.968 −0.934 −0.935 −0.988 −0.972 −0.972 −0.975 −0.988 −0.988 −0.984 −0.955 −0.959
TSSC (o’brix) 0.162 0.985 0.858 0.809 0.907 0.861 0.957 0.835 0.959 0.947 0.951 0.936 0.932 0.994 0.961 0.929 0.883
Acidity 0.977 −0.051 0.965 0.976 0.974 0.847 0.882 0.962 0.981 0.913 0.907 0.950 0.938 0.940 0.964 0.958 0.975
Specific gravity 0.822 −0.330 0.815 0.972 0.992 0.905 0.912 0.894 0.918 0.991 0.992 0.956 0.983 0.992 0.946 0.978 0.824
Eigen Value 4.211 1.209 4.879 5.042 5.654 5.117 5.323 5.190 5.619 5.560 5.565 5.494 5.561 5.711 5.656 5.554 5.214
Variance (%) 52.289 22.728 50.514 49.128 63.257 59.249 58.861 58.130 63.529 62.333 62.383 61.999 63.129 64.132 63.524 61.348 59.537
Cumulative (%) 52.289 75.017 50.514 49.128 63.257 59.249 58.861 58.130 63.529 62.333 62.383 61.999 63.129 64.132 63.524 61.348 59.537
TOOLS
PDF Links  PDF Links
PubReader  PubReader
ePub Link  ePub Link
XML Download  XML Download
Full text via DOI  Full text via DOI
Download Citation  Download Citation
  Print
Share:      
METRICS
2
Crossref
0
Scopus
4,658
View
86
Download
Editorial Office
Division of Environmental Science and Ecological Engineering, Korea University
145 Anam-ro, Seongbuk-gu, Seoul 02841, Korea
Tel : +82-32-560-7520   E-mail: envitoxic@gmail.com
About |  Browse Articles |  Current Issue |  For Authors and Reviewers
Copyright © 2024 by The Korean Society of Environmental Health and Toxicology & Korea Society for Environmental Analysis.     Developed in M2PI